
Tired of Being Chopped Up To Death?
Tell me if you’ve heard of this. You’ve put in the work. You found your favorite stock, double-checked the fundamentals, triple-checked your favorite technical indicator…
Time to pull the trigger and buy. The good news is the stock doesn’t absolutely fall out of bed as soon as you put on the position. The bad news? It doesn’t do anything. The stock just chops around. There’s an opportunity cost to this. By putting up capital in a “dead money trade,” you miss out on all the stocks that are ripping.
Even worse… say you bought some calls, and they’re decaying.
Finally you throw in the towel. Screw it– you’ve got better places to put your money to work. One or two weeks later, the stock takes off. Sound familiar? While it’s not a huge loss, it’s still just as frustrating. You not only lose out on the trade, you lose out on the missed trades, and your psychological capital is drained. What if we could flip this around? What if I show you that it’s possible to identify stocks that are finally ready to breakout?
Introducing The Moon Setup
The Moon Setup gives you the ability to scan and trade stocks that are on the verge of an explosive move higher.
What’s The Name About?
I’ve been working with option trading clients for a decade. When I take this setup, I would receive emails asking “hey what’s your price target on this stock?”
My response has always been: The Moon Setup.
The Moon Setup searches for price action that is much stronger than what the stock has experienced in the past.
It’s a setup that has a lower odds of success compared to other conservative option trading strategies.
Because the payout is much more than the risk taken, the trade setup has a positive expectancy.
I’ll step you through the two key elements of the Moon Setup, but first let’s talk about the reasoning behind the trade and why it’s so powerful.
The Psychology Behind the Moon Setup
Think about a stock that has seen a strong move higher. Profit takers come in, and maybe short sellers start getting a little aggressive betting on price to head lower.
And while there may be a small pullback, the stock continues to trade near its highs because there are still plenty of institutions that want to add to their positions. We start to see exhaustion by traders looking for the Next Big Move.
No follow through in either direction.
Volatility Compresses. Tighter and tighter. Ranges.
Until nobody wants to try and play the breakout, then the stock moves big. Anybody who wanted to sell has already sold, and all fresh buyers are in a position of strength and have no reason to sell.
The stock takes off like a rocket and never looks back.
Options Trading Expert Reveals His Strategy…
I want to show you how to trade options like a champion… And inside this guide, I’ll show actual examples of option portfolios that you can follow to get started right away. The key is using leverage… Let me show you how.
Click here to download your free eBook.
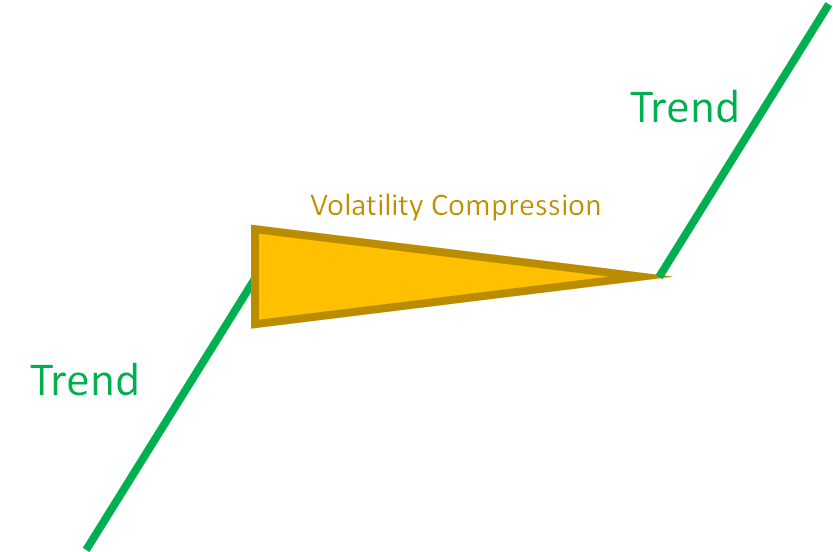
If a stock sees enough volatility compression, the odds of volatility expansion in the direction of the trend are very high.
That’s what gives us such a strong trading setup.
Two questions we’re going to answer:
1. How can we identify a stock still in an uptrend?
2. How can we identify volatility compression?
That’s what we’re going into next.
How to Find Uptrends
For the Moon Setup, we want to find stocks that have a trend of higher prices.
For the purposes of the Moon Setup, we’re going to keep it simple.
We’re going to focus on stocks that are within 10% of their 52 week high.
If a stock has managed to undergo sideways action and still be within 10% of it’s year high, what does that tell us?
There is long term institutional interest that keeps the stock elevated near current prices.
If you use scans inside of thinkorswim, here is what it looks like:

Now let’s think about the second part of the Moon Setup:
How can we identify stocks that are in a period of volatility compression?
How to Find Volatility Compression
I’m an options guy, so I can spend 3 hours going over all the different ways we can define the word “volatility.”
In this case, we’re just going to focus on one case:
Volatility is how far and fast the a stock will trade away from its average.
We have an indicator that does all the heavy lifting for us.
Bollinger Bands
Bollinger Bands are an adaptive volatility envelope that measures the expected move that a stock can move away from its average.
Here’s a look at the S&P 500 with a Bollinger Band.
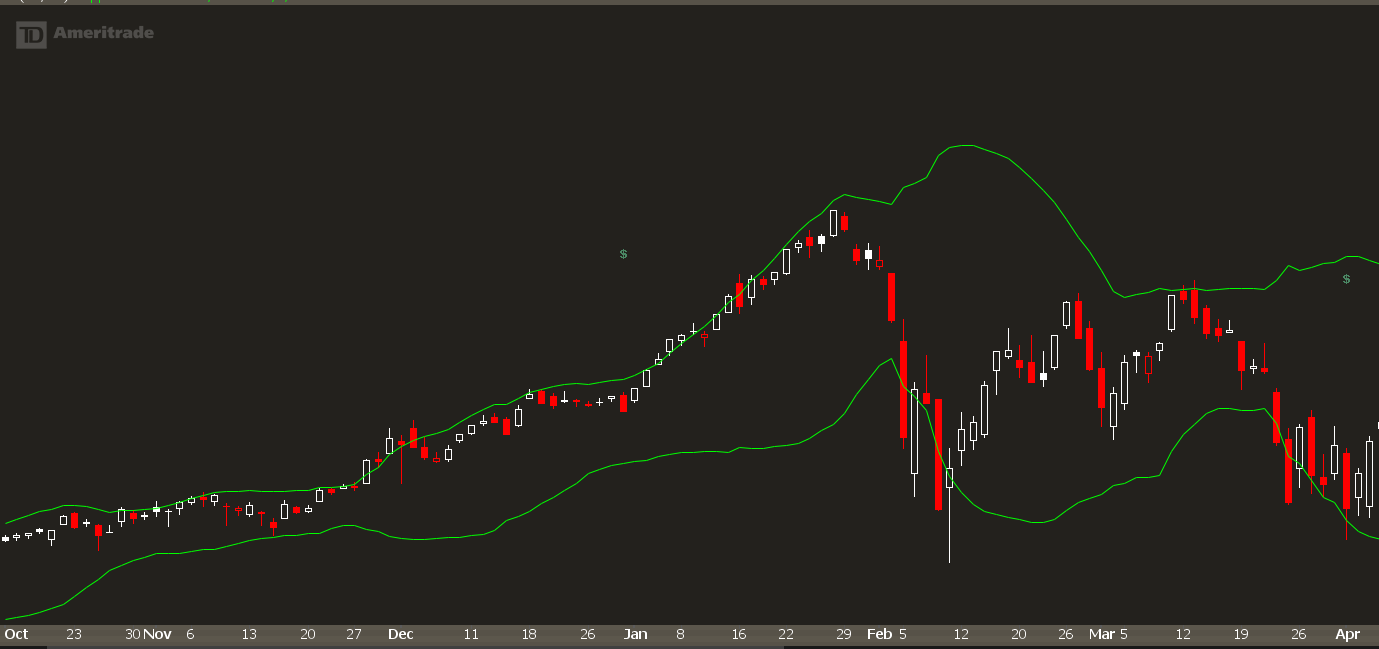
The “trendiness” of a market goes from low to high.
And the easiest way to measure the trendiness is the width of the Bollinger Bands.
Look at that chart. See where the market had that nasty 10% correction? The “BB Width” was huge.
6 months before that? All was quiet, markets were boring. Tight BB Width.
For the Moon Setup, we want to scan for stocks that have very tight Bollinger Bands.
If you have other trading indicators on your chart, Bollinger Bands can easily add more confusion in your analysis.
Let’s simplify. Since we’re only focusing on the width of the Bollinger Band, why not just look at that?
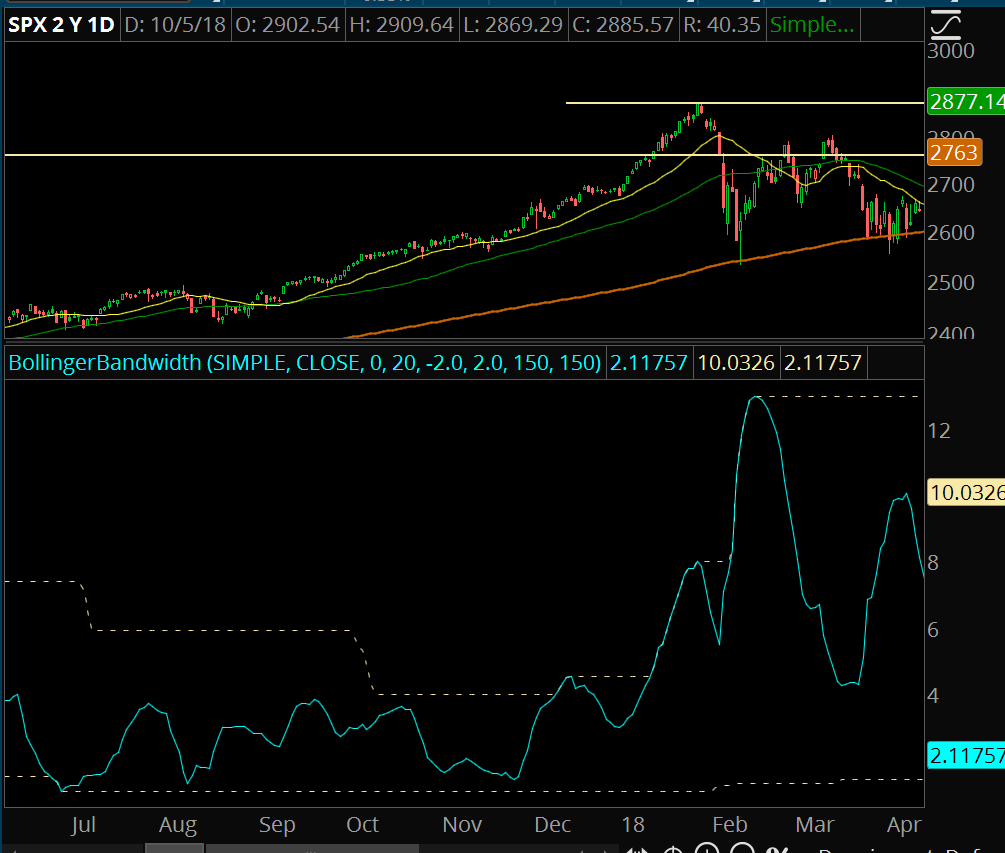
The lower indicator shows us the distance between the lower and upper Bollinger Bands.
With the Moon Setup, we’re going to focus on stocks that have volatility compression.
More specifically, stocks where the Bollinger Band width is near its lows of the year.
We’re going to look for stocks that are within 20% of their lowest Bollinger Bandwidth reading of the past 150 trading days.
This is an easy scan to create as well. If you use thinkorswim, you can add this:

If you’re finding too many setups, simply change the filter to 0.9 to widen the net of potential stocks to trade.
Combine that with our trend scan, and you have the ability to find stocks that are near their highs but haven’t moved in a while.
Considerations When Scanning For Stocks
The Moon Setup has two main filters:
1. Stocks in Uptrends
2. Volatility Compression
There are a few other filters you can add to help with finding the best stocks that fit in the Moon Setup.
Volume
This is pretty simple. If there is no liquidity, then it doesn’t make sense to put on the trade.
Low volume stocks are like a roach motel. Easy to get into, but if things go wrong then the bid drops out and you’re left holding the bag.
Stock Industry
The Moon Setup works best with high growth industries and stocks.
More mature stocks with low volatility will have more failed breakouts and false moves… and you just won’t see the kind of movement to justify aggressively putting on risk.
If a stock has a high dividend, is a mature company, and has low volatility overall, you should focus your attention away from these names.
I also avoid energy and commodity names, because many times the stock price is tied to oil or gold.
The Narrative
This is a “squishy” filter, meaning it can’t be easily stuck into a black and white category.
Many times a stock or sector will get hot. These sectors and stocks often have the best success rate because if the narrative takes hold, it attracts more attention from institutional investors.
It becomes a self-fulfilling prophecy.
The Moon setup allows you to get in front of that trade, before the stock gets too crowded and sellers come in.
The question is — how can we know if a stock is going to join the Narrative? There isn’t an easy answer here.
A good resource would be to use the IBD 50 list, which shows strong stocks with good growth in fundamentals.
Keep an eye on earnings surprises and breakouts as well.
Timing The Entry
There are three setups to find the best entry.
New Highs
When a stock is in extreme volatility compression, a range high or a downtrend will keep prices in check.
If the stock clears that level, then you can play for a continuation in momentum.
Failed Breakdown
Right before a stock finally breaks out, there are usually one or two “shakeouts” in the stock.
Institutions will put pressure on the stock by selling it, or pulling the bid out of the stock. That leads to stops getting hit, and guess who is there to absorb those stops? The firm that wants to buy the stock.
This is a failed breakdown, also known as a 2b reversal pattern. Look for an “obvious” support level, a break under that level, and then enter if there is a hard reversal above the obvious support.
Retest or Consolidation
Stocks don’t have to go straight up after a breakout.
If you’re late to the party, don’t panic.
You can look for a continuation pattern like a bull flag or bull pennant pattern.
Many times there is a “base on base” pattern, and you’ll often see another Moon Setup just a few weeks after the primary breakout.
How To Trade This Setup With Options
With Moon Setups we want to be net option buyers.
We are bullish on the stock, and bullish on volatility.
When a stock is range bound, it gets boring. And when it’s sideways, investors start to think about how to generate income on the stock since “we’re going nowhere.”
That leads to low option premium, and even lower premium on calls as investors load up on covered call positions.
This makes calls cheap. Dirt cheap. Where you have the potential to earn many multiples relative to the risk that you’re taking.
The KISS Setup
The simplest setup is this: buy calls.
Go out between 45 and 60 days and buy the 30 delta call. That gives you enough time so that even if you’re early, you have enough time to be patient and wait for the next move.
If the stock is still sideways with under 30 days left to expiration, then you can roll out a month to buy more time.
If the stock moves large in your favor, your calls will gain value, and the delta will increase.
When your delta reaches 60, you can sell the option and then buy another 30 delta option.
If this all seems greek to you, that’s because it is. You can use the delta of an option to help dictate when to adjust your trade.
Moon Setup Examples
Before we look at some real-world examples, a common-sense disclaimer.
We’re looking in the past. That means we run the risk of availability bias and survivorship bias.
There’s no guarantee that you’ll get filled on trades due to liquidity risk.
With that said I’m confident that you can use these examples as a guide for the potential profits you can earn with the Moon setup.
Square (SQ)
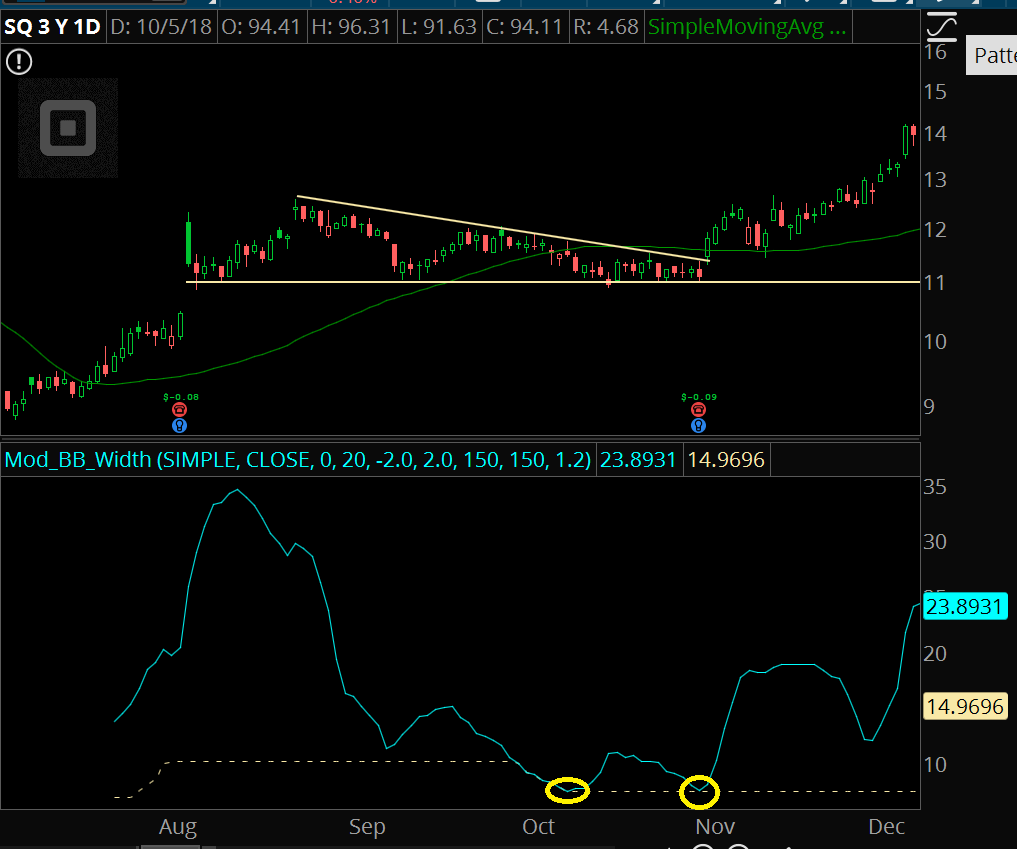
After a gap higher on earnings, the stock settles into a multi-month range. It’s a recent IPO so 52 week highs aren’t established, but the recent range highs can act as a magnet.
The volatility squeeze happens twice within the course of a month, and then the second earnings report leads to a test of the highs, and a retest.
The stock auctions up to $15 per share, where another volatility squeeze shows up:
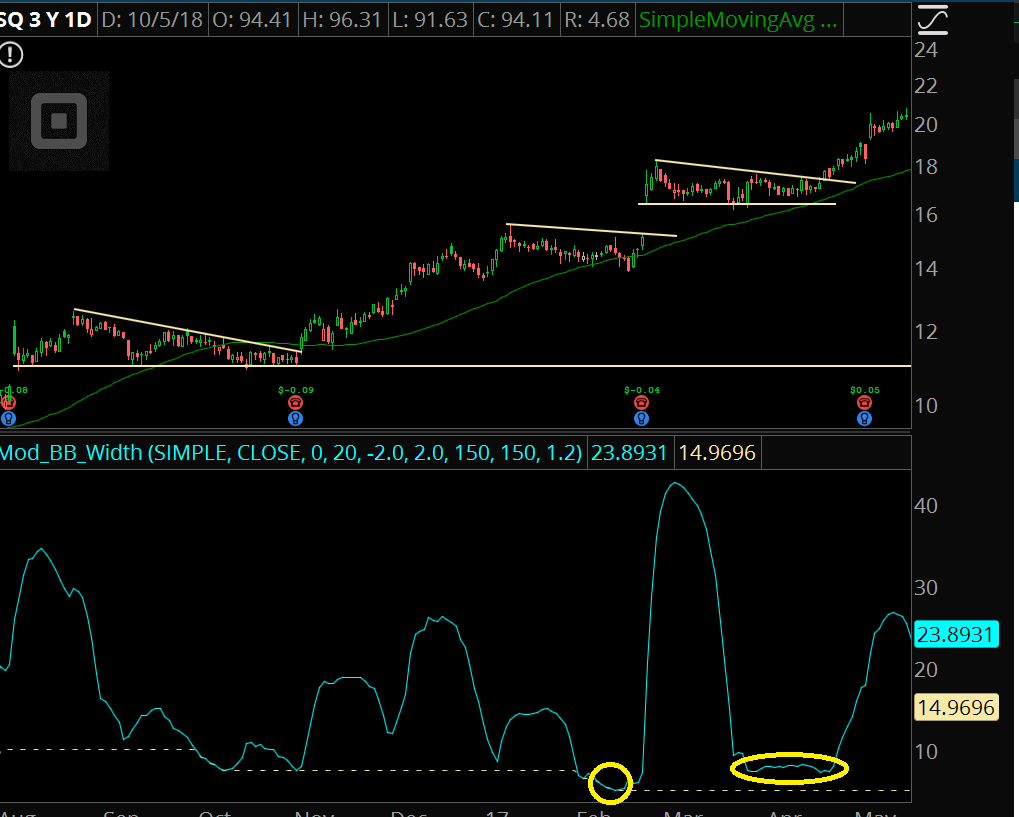
The stock then gaps higher on earnings, and while it doesn’t provide an exact Moon setup, the continuation pattern is there.
Recently it peaked at $100 per share.
Boeing (BA)
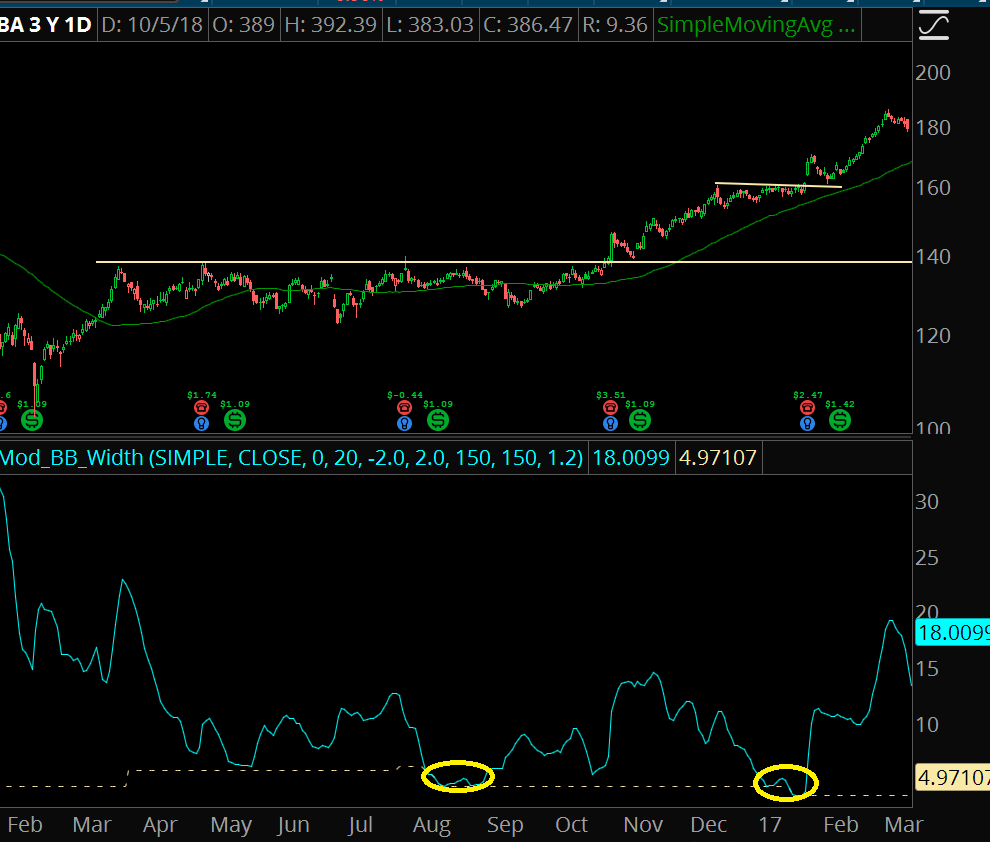
After trading in a tight weekly range for an entire year, a signal showed up in August of 2016. It took another 3 months for the stock to breakout on earnings.
After earnings, the stock retested the range highs, then started to see momentum higher.
A secondary Moon Setup was seen at the end of 2017. Same pattern– earnings breakout, retracement, and then continuation to new highs.
The stock traded up to 375 in early 2018. It now entered another multi-month range, with a Moon Setup triggering on both a daily and weekly chart.
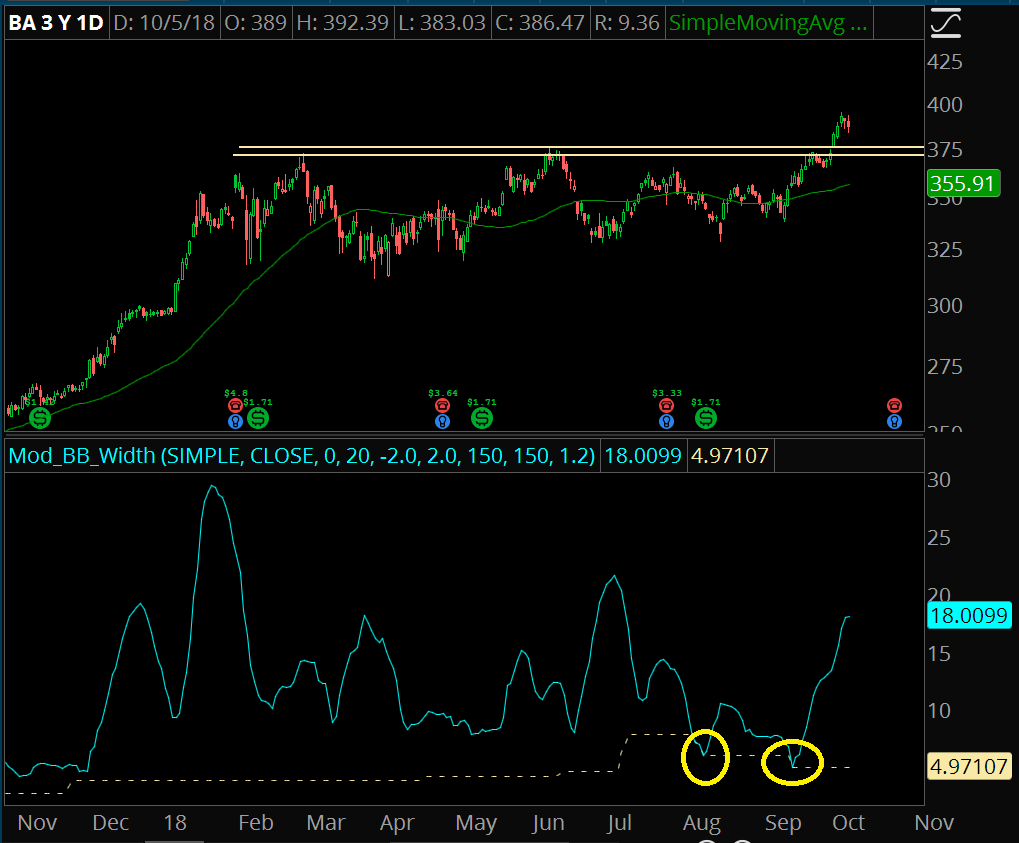
We’ll see if the Moon Setup will work on this one!
Mastercard (MA)
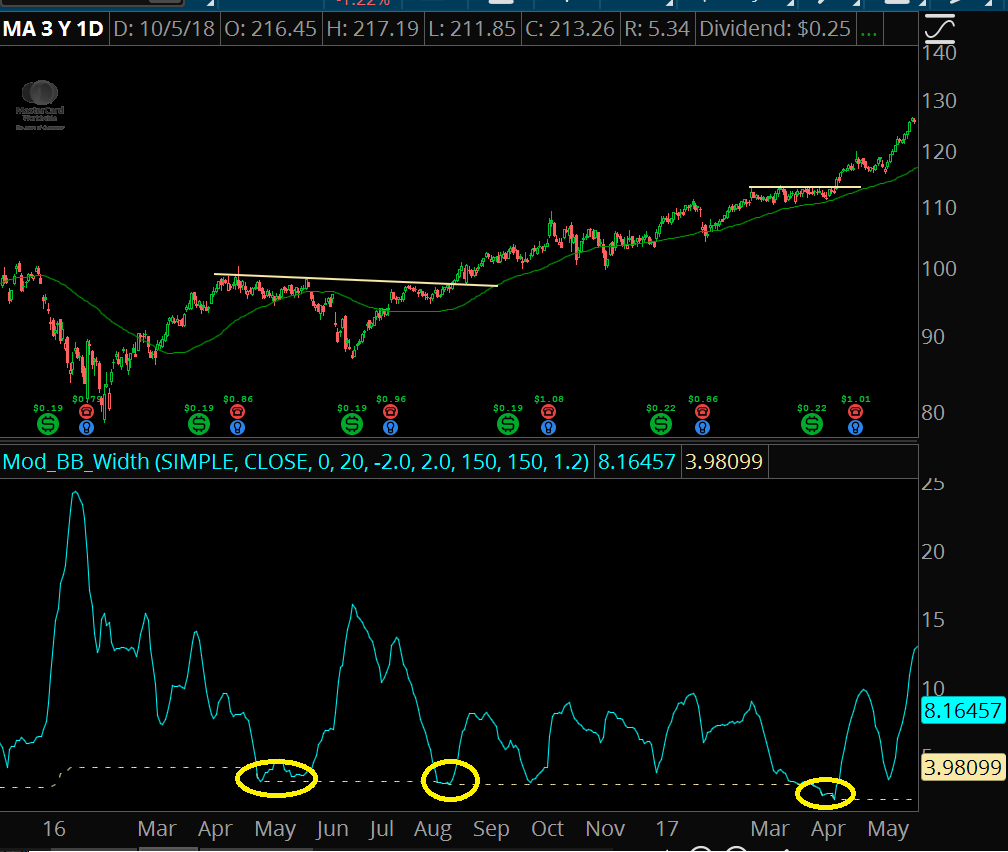
A Moon Setup shows up in May of 2016, but there is a failure to clear the range highs. After a hard correction, the stock recovers its losses and another Moon setup shows up in August. This one breaks out.
A secondary moon setup shows up in April of 2017 with a pre-earnings ramp.
The stock has traded up to over $200 per share.
Amazon (AMZN)
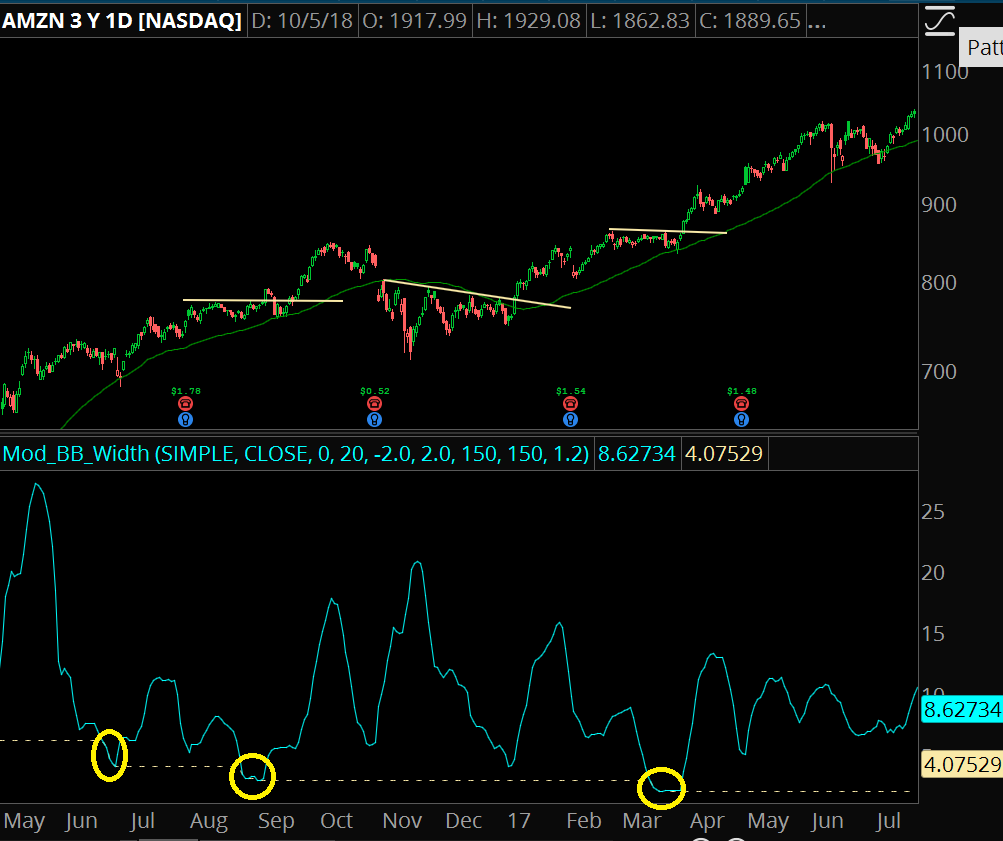
AMZN has a great example of how setups aren’t always clean. The first Moon Setup shows up around June of 2016, and the stock auctions higher until it finds a new range.
A second Moon Setup shows up in September with a failed breakout. The stock moves higher above key resistance only to lose that level, stop everyone out, and then reverse higher above the breakout level.
It’s not always easy!
Another Moon Setup shows up in March of 2017, where the stock trades from 860 and runs to the $1,000 magnet.
Finding Explosive Moves For Massive Option Profits
At the beginning of the week, run the scan.
Find stocks near highs that are undergoing volatility compression.
Set price alerts for when the stock is on the verge of breaking out, and if they move put on your trade.
It’s simple- but not easy. It can get frustrating putting on trades with a potential win rate between 35% and 50%.
Yet when you hit that one winner, it easily retakes all your losses and then some. One good trade can make your month… potentially our year.
THE SPECIAL OFFER
Get More Bollinger Setups
The Moon Setup is one of several trade setups I use with Bollinger Bands.
If you’d like all my setups, then sign up to receive your Free eBook:
Massive Profits With Bollinger Band Trading
This 34 Page Guide Will Show You…
– How To Discover Explosive Stock Trading Profits With This Volatility Indicator
– Identify When The Market Trend Will Continue — And End
– Track And Profit From Key Turning Points In A Stock
– Picking The Right Option Strategy For Any Trade
– …and much more!
Click Here to Get My Free eBook