The past 30 years have seen great advances in charts. In 1987, only brokers had charts, unless you took the pain staking task of drawing them out yourself. In the 1990’s we had the internet boom which made attaining charts much easier but many were end of day. Toward the late ’90’s trading platforms supplied charts and the chart boom began. Today, you can get just about any type of chart you like off the internet, let alone, the vast depths of trading platforms. Think about all the analytical tools and news that are available to us now in real time. There are even bots (or algorithms) that will trade for you. But with all this technology in charts and tools, it can get very confusing on what works and what doesn’t.
When it comes down to it, all traders are trying to answer a question; Long, short, or out? All these tools and techniques are trying to derive the answer to this question. But with so much information, we may come to the right conclusion, but it may be too late. So somehow we have to simplify things enough to get to the right answer quickly. I’m going to show you how I do it with today’s technology, I hope you like it.
First off, I work at DTI. We have been developing our own software for 20 years. It has evolved with the times, and though we have added some of the more conventional features in it, we have taken the same data and put it into different forms to help us understand the market easier. For example, look at the chart below. This is a 30 minute chart of Amazon (AMZN). Though most any platform can give you a 30-minute chart, there is information that you still need. Notice the gray box on the left side. Here you have the ATR (Average True Range), ID (like the beta but a little different), highs, lows, opens, buy and sell zones, the name, and when the next earnings are coming out. We grab this information on every stock we open in the chart so we can evaluate it quickly.

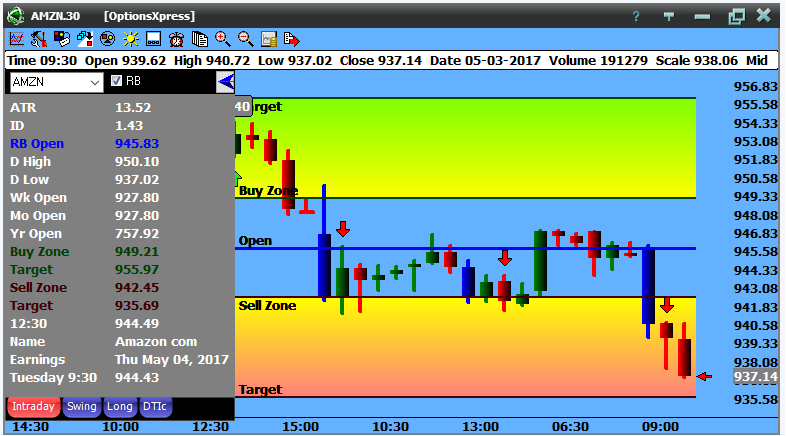
Amazon 30 Minute Chart
I need to put a foot note in here quickly. I work off of opens, not closes. At the close, you already know who won or lost. And how many of you have been able to start a race at the end? Not me. So I look at the open to see who is winning, because I want to be on the winning team. You will find that the market will hold the opens as support and resistance, and does not really care about closes. If the market is above open, bulls are in control. If the market is below the open, bears are in control. Let me show you an example of why this is important to market direction. Here is another 30 minute chart of Amazon. The big green bar was there earnings. The blue bar just after it is the open at 08:30am CT the next day. Notice that from the previous day’s close (the little red bar just before the big green bar) AMZN started 35 points higher, and by lunch it was 18 points down from open, but still 12 points above the previous day’s close. So you were looking at change column on your trading platform, it would still be green and saying AMZN is up, but if you look from open, it was down. So ask, if you bought it at open, did you make money or not? Not. I’ll agree that if you owned if from the previous day, you are still up, but you gave back a lot.

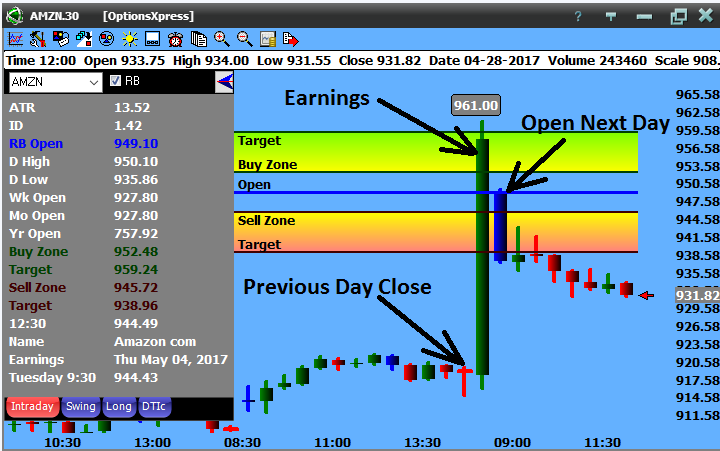
Amazon Earnings
Now that we got that out of the way, going back to the grey box on the left side, notice the week, month, and year open. So the question is, is this stock trading above these or below these? Above them right? So Amazon is bullish, but intraday, it is bearish. You could short it today (or buy puts, or sell calls, whatever) but it is probably not a good idea to hold that for very long. If you go back to the first chart I showed you, you will notice that it was coming of the 950 area down to 937, that was the second day after earnings. It bounced back up and now is higher than the 931 area. So it is still stronger than weaker, but a good short the day after earnings based how it traded off the open.
They buy and sell zones on the chart take this a step further. If above all the opens and the market you are looking at moves up into the buy zone, this just confirms the overall trend. These zones will change twice a day during the US day market; once at 08:30am CT and again at 12:30pm CT. As the stock moves from open and penetrates into one of the zones, this is the first penetration. When the next bar exceeds the first bar you will get a confirmed penetration and an arrow will appear letting you know there is a confirmed penetration and it is time to act. Look at the chart below on Silver. Notice the blue penetration bar and then the confirmation bar. The confirmation bar has a red arrow on it to alert you that silver is heading lower. Notice it is below the week and month open. Still above the year, but the short term and intermediate term are week. Once it hits the target, it just moves sideways.

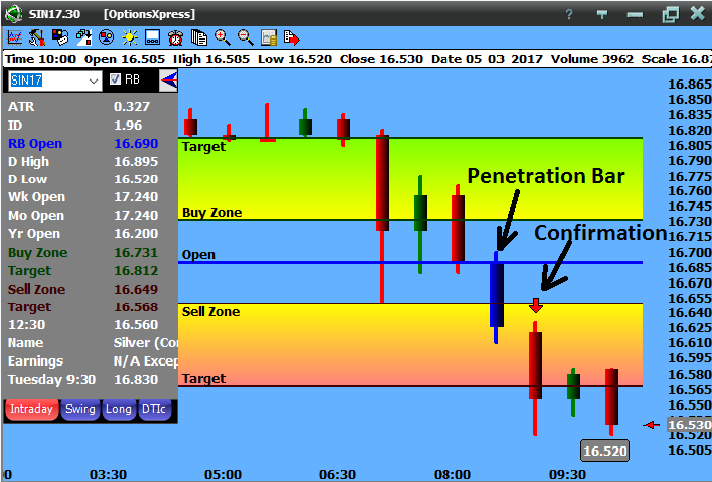
Silver Chart
This is great for one chart, but if you want to look at multiple markets, you may end up opening many charts, and it is hard to keep track of so many charts. So we simplified it even more with another feature called the Portfolio Manager (PM). In this, you can enter as many symbols as you like, and it will turn green or red as it enters into the buy and sell zones. You can even set up alerts that can text you on your phone when a stock or futures contract moves into the buy or sell zones so you don’t have to be at your computer watching all the stocks. Below is a picture of the PM. It changes color based off the buy zone (green) or sell zone (red). If just white, it is between the zones.

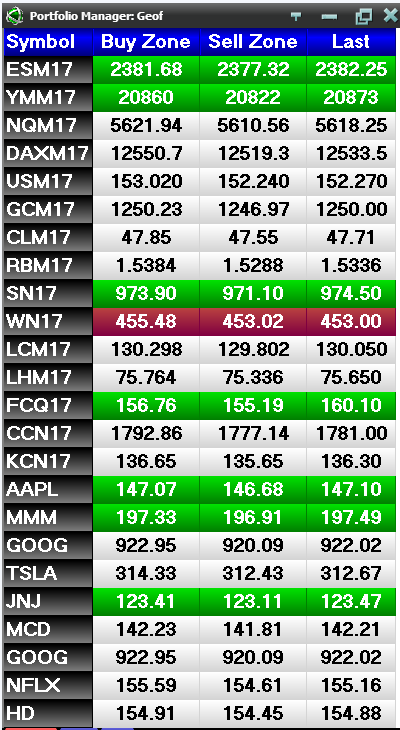
I keep the index futures at the top, noting that if at least 2 out of the 3 at the top are the same color, I can buy a stock that is the same color, and have the odds in my favor for making money. Notice that the ES and YM at the top are green. In that case I can buy JNJ, MMM, or AAPL with the likelihood of making money.
Instead of me having to sit in a chair, staring at a computer screen all day, I now have the technology to have my computer do the work as I find a good book to read, or need to water the garden. This is nice since I spent so many years sitting in front of a computer reading all the markets to find one to trade. I can now spend more time finding stocks I may want to trade and just plug them in the PM and have it do the work for me. Another nice feature, not only can it do it on an intraday basis, but on a swing and long-term basis as well. Though we still need to pay attention to overall market direction, we can make trading more mechanical and take a lot of the guess work out of it.