Selecting a Low-Risk Entry Point
One of the simplest but most effective entry timing indicators are the Keltner Channels which can quickly and easily be downloaded from investing websites such as www.StockCharts.com. Steps for down loading the Keltner Channels follow.
The Keltner Channels function as an overbought/oversold indicator that can help us select a buy point for stocks and call options that are on a EMA System ‘buy’ signal. Overbought is a term used to describe a stock that has been increasing in price over a period of weeks or months with very few price pullbacks. Oversold is a term used to describe a stock that has been decreasing in price over a period of weeks or months with very few prices increases.
Stocks in a price up trend do not advance in a straight line. There are always price corrections or retrenchments along the way. Like the tide there is an ebb and flow in the price movements in stocks. This is the natural order of the markets . . . stocks advance and then the price declines inevitably as profit taking occurs.
Stocks can remain in an overall price up trend as these price declines occur as long as the price decline is not severe enough to cause the 50-Day EMA line to cross below the 100-Day EMA line which signals a trend reversal from a price up trend to a price down trend. When this occurs a stock should be sold.
The Keltner Channels are a valuable timing tool as the channels can help us prevent buying stocks when they are in an overbought condition. When stocks become overbought they are vulnerable to profit taking and minor price declines within the context of remaining in a price up trend. The Keltner Channels can help us avoid buying stocks when they become overbought and instead buy stocks and call options when they become oversold.
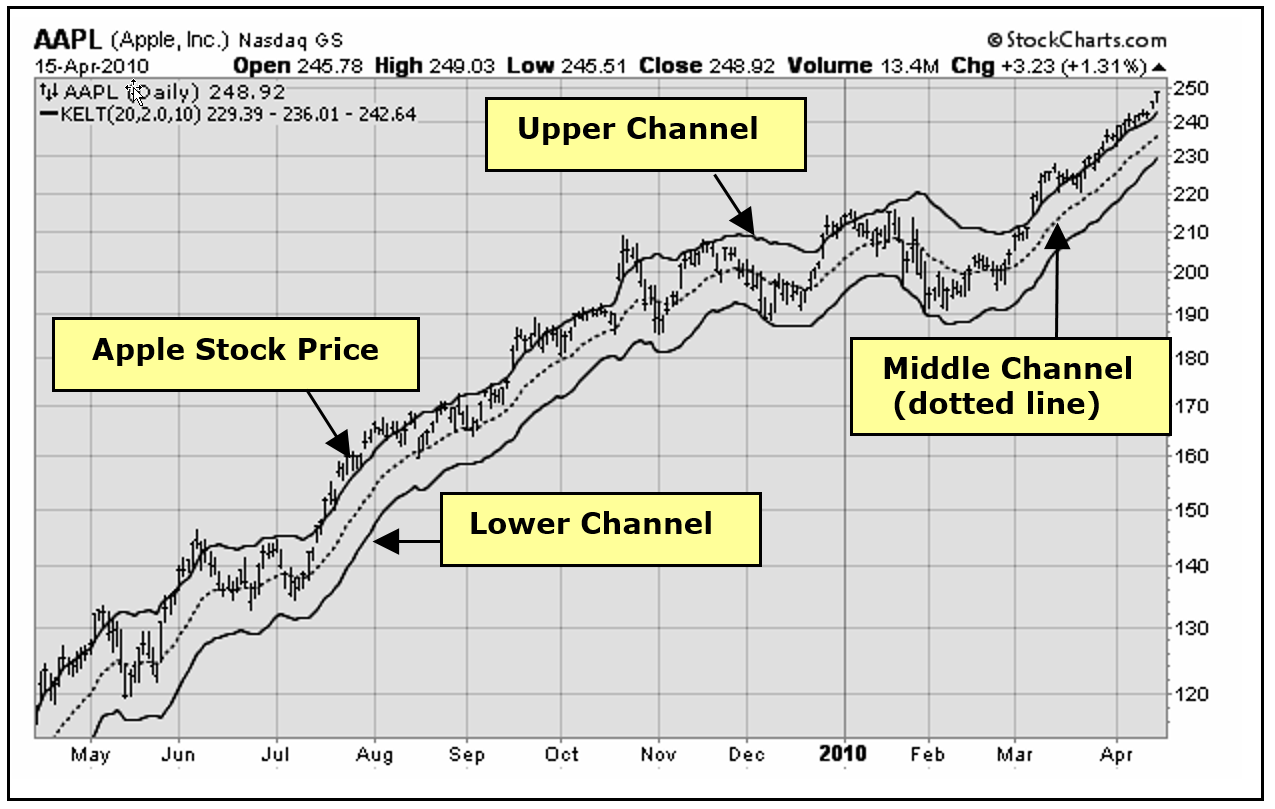
Let’s take a look at an example of the Keltner Channels and how they can help us select our entry point. The price chart below displays the daily price movement for Apple stock along with the three Keltner Channels. There is an upper channel, middle channel (which is the dotted line) and a lower channel.
When a stock trades near the upper channel it is an indication the stock is becoming overbought and will most likely encounter selling pressure and then trade back down towards the middle or lower channel.
When a stock trades near the lower channel it is an indication the stock is becoming oversold and will most likely encounter buying pressure and then trade back up towards the middle or upper channel.
Options Trading Expert Reveals His Strategy…
I want to show you how to trade options like a champion… And inside this guide, I’ll show actual examples of option portfolios that you can follow to get started right away. The key is using leverage… Let me show you how.
Click here to download your free eBook.
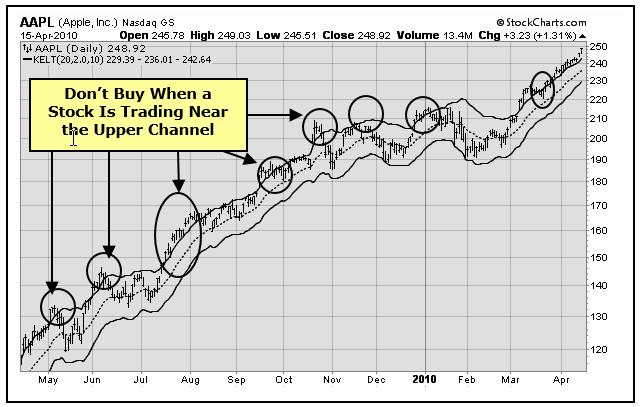
If you are considering buying Apple stock or weekly call options, you don’t want to buy if the stock is trading near the upper channel as there is a good chance the stock will encounter selling pressure near the upper channel and then decline in price.
It is better to wait until the stock trades near the middle or lower channel before buying. This results in a better entry as the stock most likely will trade back up towards the upper channel.
Note: Apple trade examples were taken prior to the Apple 7 for 1 stock split and prices are not split adjusted.
 Circled below are examples of Apple stock trading above the upper channel. When a stock is trading above the upper channel it is better to wait for the stock to decline towards the middle or lower channel before buying.
When a stock is trading near the middle or lower channel there is a good probability that it will rally back towards the upper channel.
In each of these examples, after the stock traded above the upper channel it declined back towards the middle or lower channel within a week or two except for the example that occurred in mid-July. In this example the retracement took a little longer as the stock traded near the upper channel in mid-July and did not retrace back to the middle channel until mid-August. This happens occasionally in strong bull markets.
Currently Apple is trading above the upper channel and has stayed above the upper channel for several weeks not presenting any buying opportunities. In our experience this is very rare. Currently Apple stock would have to decline to about 236 before it touches the middle channel.
Identifying the Keltner Channel Price Levels
Whenever you download a Keltner Channel price chart, the price chart will list the price levels for the Lower, Middle and Upper Channel. Currently the Lower Channel price level is 229.39 (circled below). The Middle Channel price level is 236.01 and the Upper Channel price level is 242.64 (circled below).
Lower Channel Currently at 229.39 Price Level
Middle Channel Currently at 236.01 Price Level
Upper Channel Currently at 242.64 Price Level
If you are considering buying Apple stock or weekly call options, you would want to wait until the price of the stock declines to the middle or lower channel price level which is the 236.01 to 229.39 price level in this example.
Actual Trade Examples Using the Keltner Channels
Our brokerage account trade confirmations below list purchases we made for Apple stock. The confirmations list the date of purchase and purchase price.
.png)
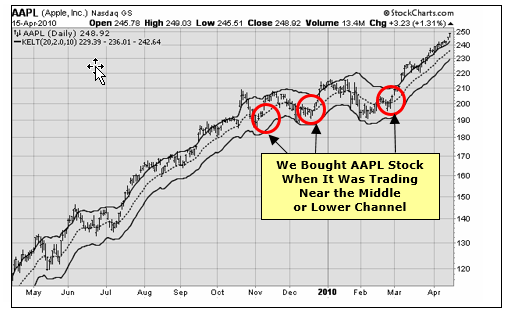
We used the Keltner Channels to help select our purchase entry point. We bought Apple stock and call options when the stock was trading near the middle or lower channel which lowers my entry risk of buying stock when it is overbought and due for a price correction. These actual entry points are circled below.
You can see from the price chart that Apple stock did not decline in price much below our entry points. Using the Keltner Channels to help time our entry points reduced the risk of our stock purchase. With Apple stock trading near 249 we now have a substantial profit for our stock purchases.
.png)
Timing Our Stock and Call Option Purchases
We have found the Keltner Channels to be a valuable timing tool that helps us select a low risk entry point for our stock and call option purchases. Buying a stock when it is trading near the lower or middle channel may help prevent buying stocks when they are in an overbought condition and are vulnerable to price declines.
We like to buy a stock when the stock is trading near the middle or lower channel and is oversold. When a stock is oversold there is a good probability that it will rally back towards the upper channel providing us with a lower risk buy point.
We avoid buying a stock when it is trading near or above the upper channel and is overbought. When stocks become overbought they are vulnerable to profit taking and will most likely encounter selling pressure.
The price charts that follow show examples of entry points for call option purchases using the Keltner Channels. The stocks in these examples were giving is an EMA ‘Buy’ signal and retraced near the Middle or Lower Keltner Channel.
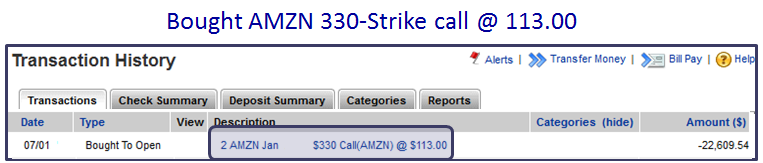
Our brokerage account Transaction Reports show the date that we purchased a call option and that date is circled on the price chart above.
Notice how the Keltner Channels allowed us to get low risk entry points for our call purchases as the price of the stock rallied after our call option purchase.
AMZN Retraced Near Middle Keltner Channel Which Enabled a Low Risk Entry Point. The Stock Rallied After Entry
.png)
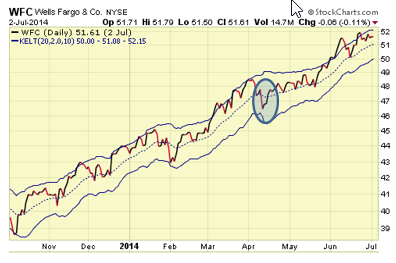
Wells Fargo on EMA System ‘Buy’ Signal
Retraced Near Lower Keltner Channel
Which Enabled a Low Risk Entry Point
Stock Rallied After Entry
Timing Bearish Entry Points
The Keltner Channels can also be used for timing bearish entry points. The Keltner Channels indicate an overbought condition for a stock/ETF when the stock/ETF is trading near the mid to upper channel or above the upper channel.
Stocks in a price down trend do not decline in a straight line. There are always price rallies along the way. Stocks can remain in an overall price down trend as these price counter trend rallies occur as long as the price rally is not strong enough to cause the 50-Day EMA line to cross above the 100-Day EMA line which signals a trend reversal from a price down trend to a price up trend. When this occurs short positions should be closed out.
The Keltner Channels are a valuable timing tool as the channels can help us prevent establishing short option positions when the underlying stock/ETF is in an oversold condition. When stocks become oversold they are vulnerable to counter trend rallies within the context of remaining in a price down trend. The Keltner Channels can help us avoid establishing short positions when the underlying stock/ETF becomes oversold and instead establish short option positions when the underlying stock/ETF becomes overbought.
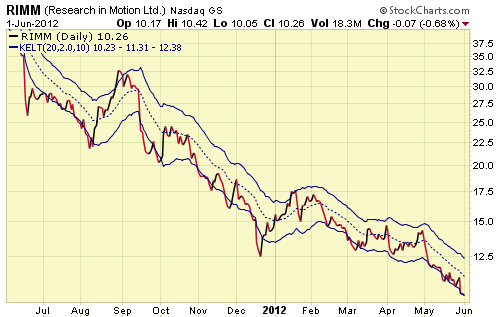
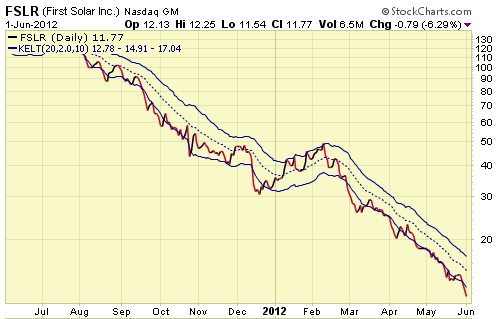
The price charts that follow are examples of stocks/ETFs that are in confirmed price down trend but became temporarily over bought when the stock/ETF price rallied back up to the middle or upper channel presenting numerous low risk entry points for establishing short option positions.
Yes, the Keltner Channels clear the clouds of confusion and pave the way to clear decision making. Once you understand the channels of success it will become very clear when you should establish bullish and bearish option positions.
The Keltner Channels are a great tool that can help you establish low risk entry points for your option trades which in turn can increase the profit potential and accuracy of your option trades!
On the following page we will show you how to download the Keltner Channels and make them yours! For us, the Channels are the end all. There is no better guide to help me push away confusion and doubt. Securing a low risk entry point in trading is huge! This tool is invaluable! Learn it, embrace it, and use it!
In summary, we have experienced many years of success using the Prime Trade Select process to select option trades with the best profit potential. I hope you learn and embrace this valuable trading tool.
Downloading the Keltner Channels
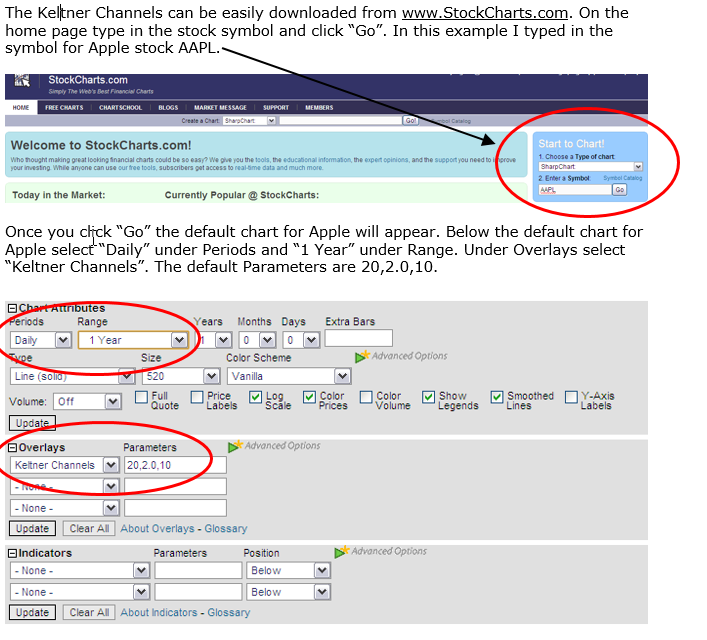
Click “Update” and the Apple price chart with the Keltner Channels will be displayed (see price chart on the following page).
THE SPECIAL OFFER
Get my Free Strategy Guide and learn more about my options strategies and the options trade you can make today with just $270.
This FREE Strategy Guide reveals how to start trading options on a shoestring budget.
Get Your Free Strategy Guide Here!
ABOUT THE AUTHOR

Author: Chuck Hughes
Company: Hughes Optioneering
Website: ChuckHughes.com
Services Offered: Web based advisory service. Real time results
Markets Covered: Stocks, Options, eBooks
Chuck Hughes has been trading stocks, options, currencies and commodities for 30 years and has won eight World Champion Trader titles, more awards than anyone else in World Trading Champion history.