
Hello, my name is Steven Primo and I have been actively trading the markets for over 41 years now – beginning as a 9-year Specialist on the floor of the Pacific Stock Exchange, to managing a private Emini Fund. Later on in my trading career I held the position of Director of Education for a number of websites until I ultimately became the President and Founder of my own company, Specialist Trading, which focuses primarily on trading education.
I have experienced and traded just about every market environment imaginable, from the Crash of ’87 to the great Bull market that followed, but I’ve learned that one thing remains constant. Regardless of market conditions, most traders – especially Emini traders – will blow out their accounts within the first year of trading. Please be aware that when I say “blow out” I do not mean they will sustain a series of losses. I mean they will actually lose their entire trading accounts. It’s at this point that a prospective trader must make a decision – either to end his dream of one day becoming a successful trader, or to begin the long journey towards acquiring the insights, wisdom, and trading strategies needed in order to become a successful trader. The good news is that I’ve already made that journey for you. My goal is to shorten your learning curve by teaching you how to trade with the edges that I’ve already acquired within my 36 years of trading. My goal is to teach you how to trade with the Specialist’s Edge.
In this article, I will share with you two highly powerful but simple edges that have literally sustained me throughout my trading career.
Edge #1
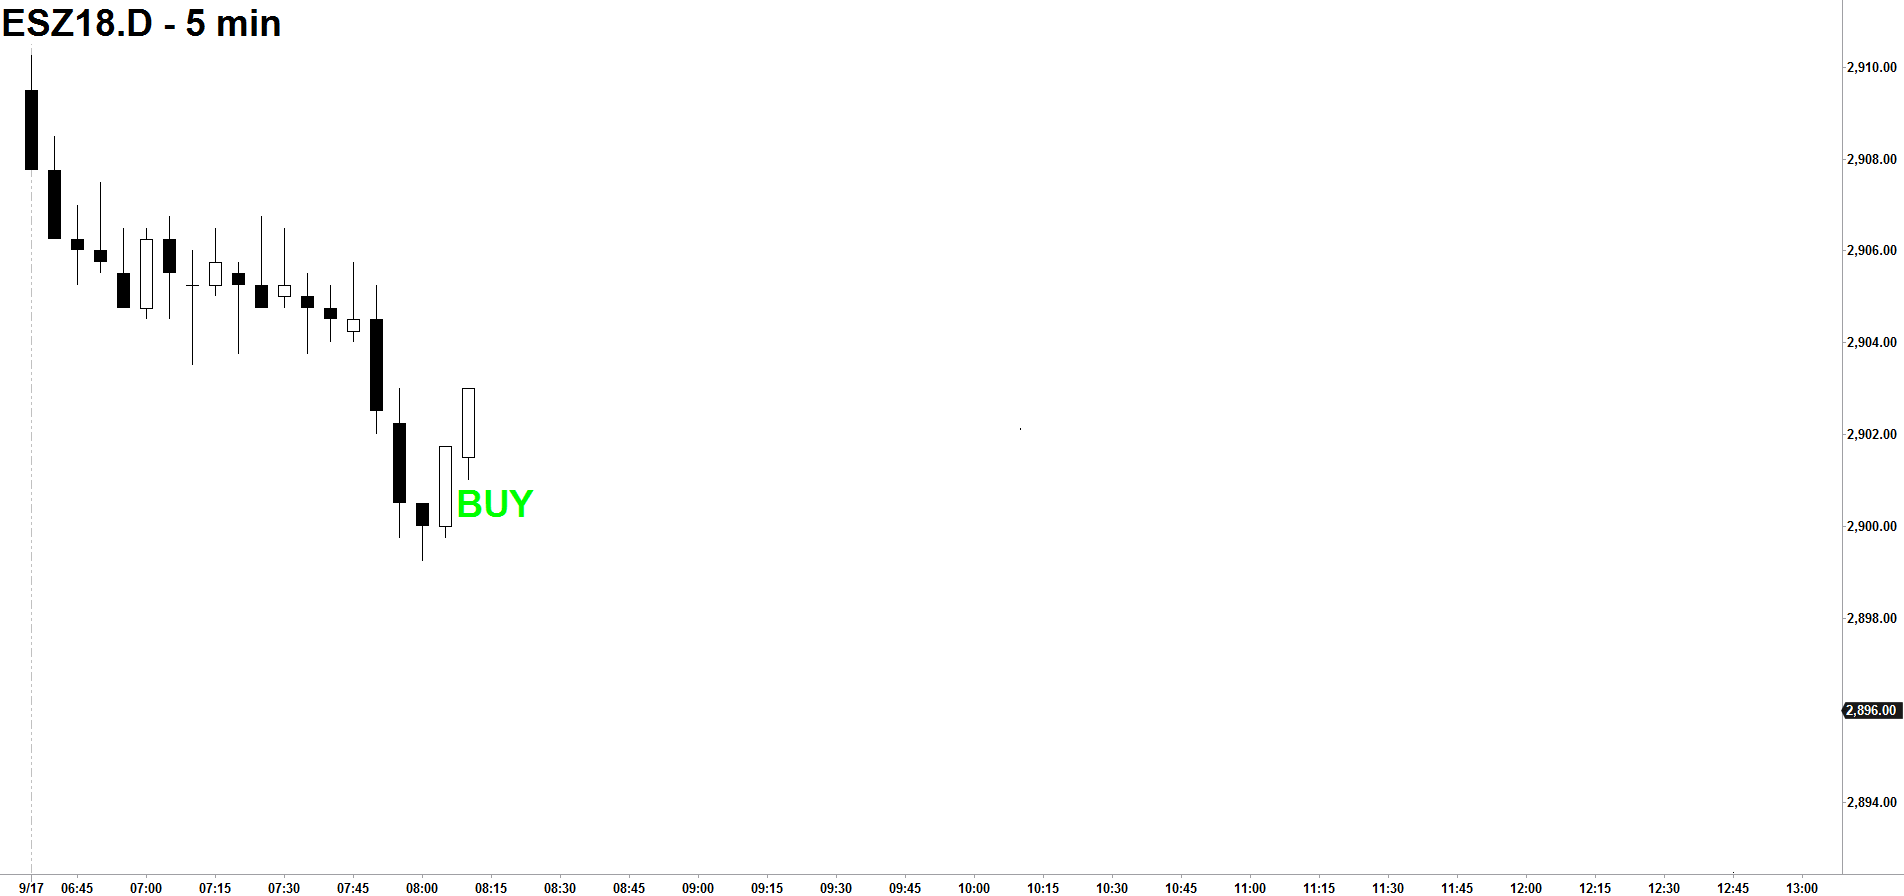
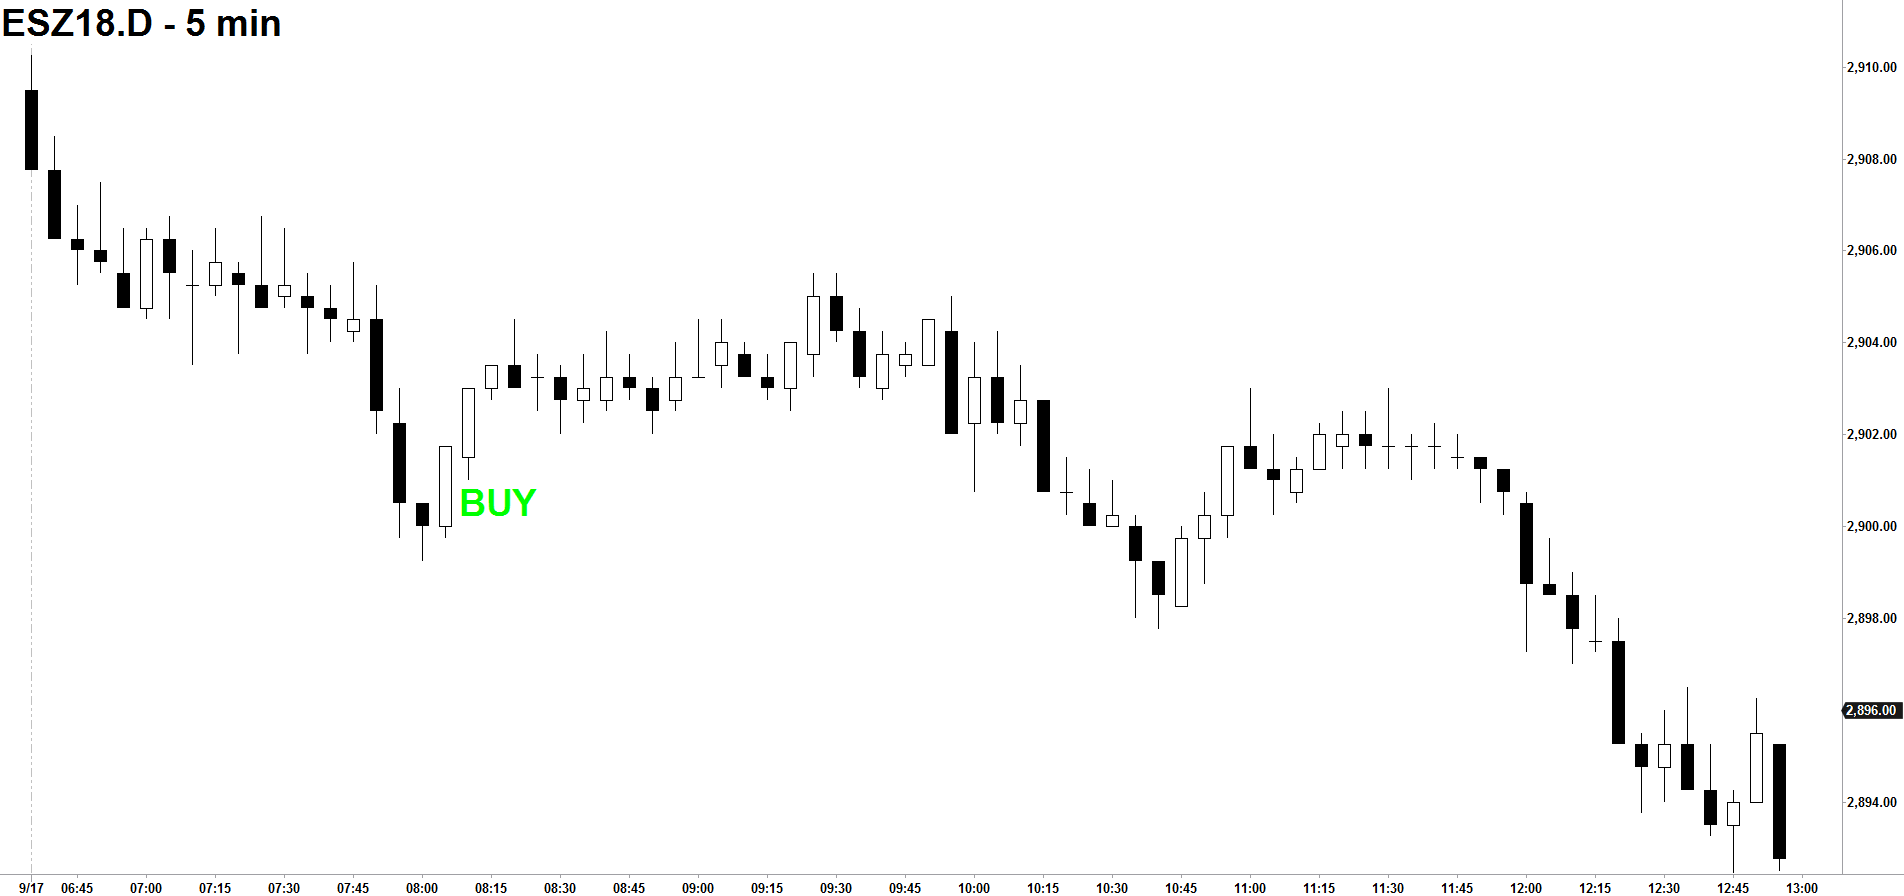
Let’s begin by looking at Fig. 1 and asking a simple question, “Has this ever happened to you before?” The market has been moving to the downside and continues to head lower until you decide it’s bottomed out and time to buy. After all, according to your strategy the Emini looks tremendously oversold and the 5-minute bar appears it’s due for a quick rally to the upside. So you jump in and buy at the market, but guess what happens? By the end of the day and into the next, the market begins to make new lows. (Fig. 2) Look familiar?
Figure 1

Options Trading Expert Reveals His Strategy…
I want to show you how to trade options like a champion… And inside this guide, I’ll show actual examples of option portfolios that you can follow to get started right away. The key is using leverage… Let me show you how.
Click here to download your free eBook.
This is the way 99.9% of all traders trade – by trying to pick tops and bottoms. But what if there were a simple tool designed to get you on the right side of the market? One that could tell you the right time to buy and the right time to sell. At Specialist trading there is. Enter the Buy/Sell Line, the most powerful trading tool we employ at Specialist Trading and the foundation for virtually every trading strategy we teach. If there were only one technique I could use for the remainder of my trading career, it would be this.
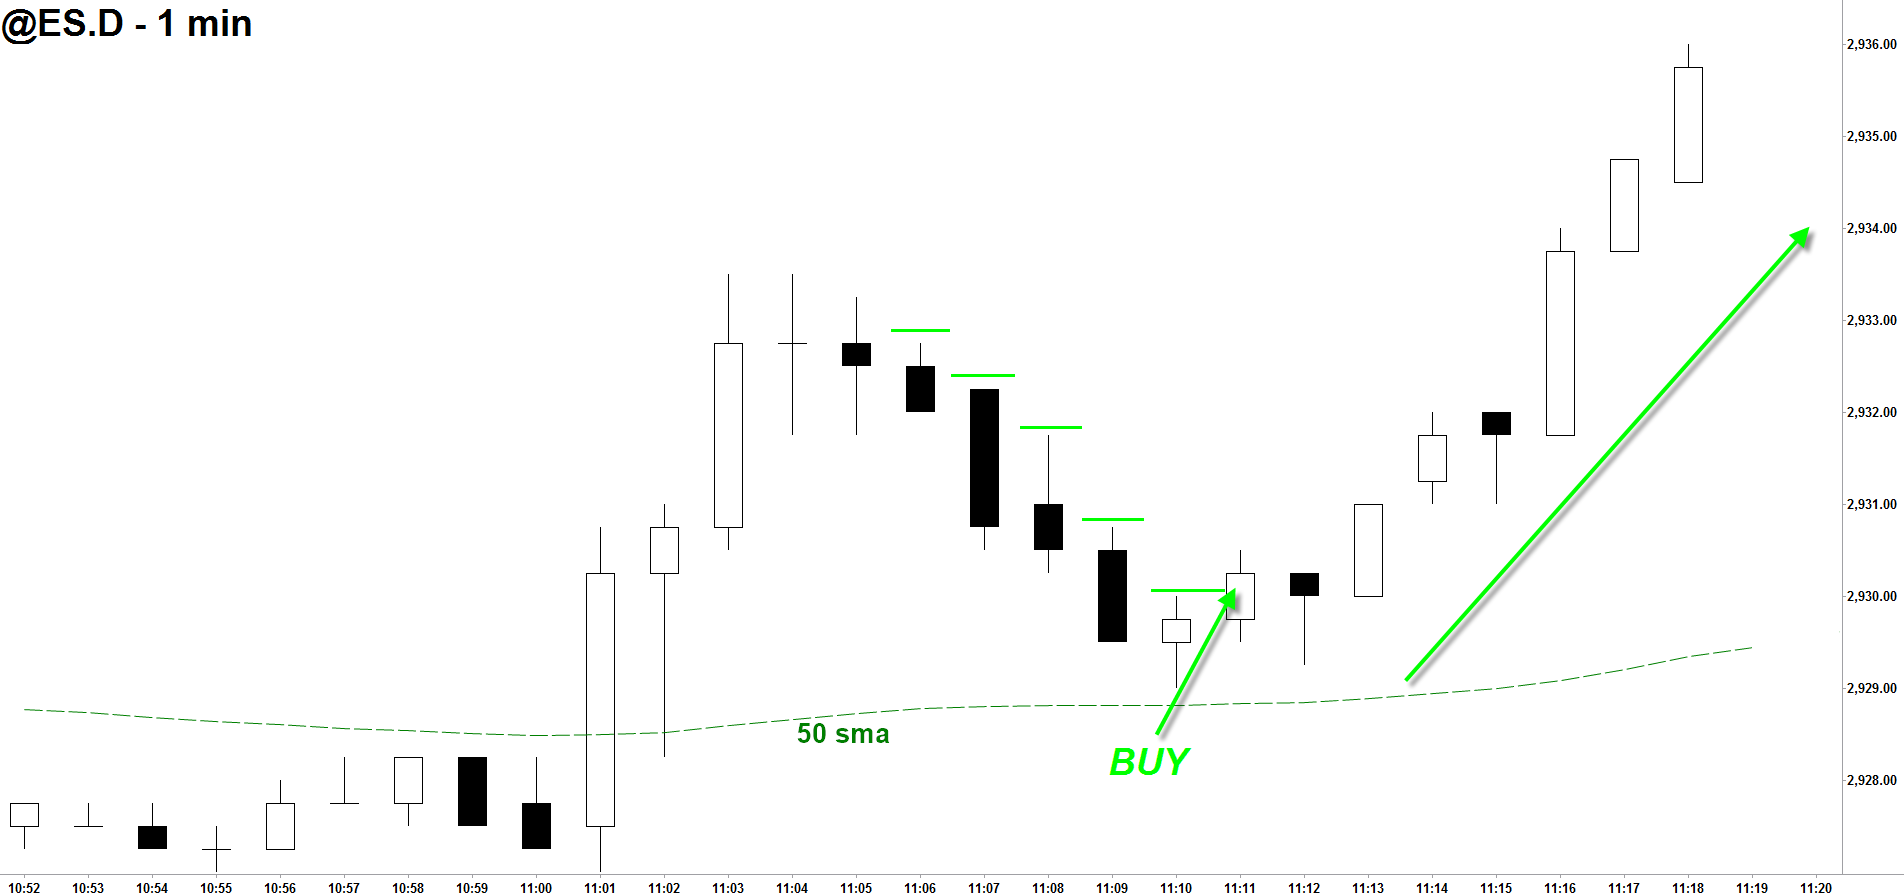
So just what is the Buy/Sell Line? It’s the 50-period simple moving average, that’s it. But in order to use this tool properly you must first plot the moving average and then ask yourself this question prior to each and every trade. Regardless of the strategy, regardless of the direction or time frame, always ask yourself before you pull the trigger – “Where is price in relation to the Buy/Sell Line?” You’ll only come up with two possible answers: 1) if price is above the Buy/Sell Line you’ll only be taking buy signals, and 2) if price is below the Buy/Sell Line you’ll only be taking sell signals. That’s it. This tool is so simple but extremely powerful and has literally saved me hundred of thousand of dollars throughout my trading career.
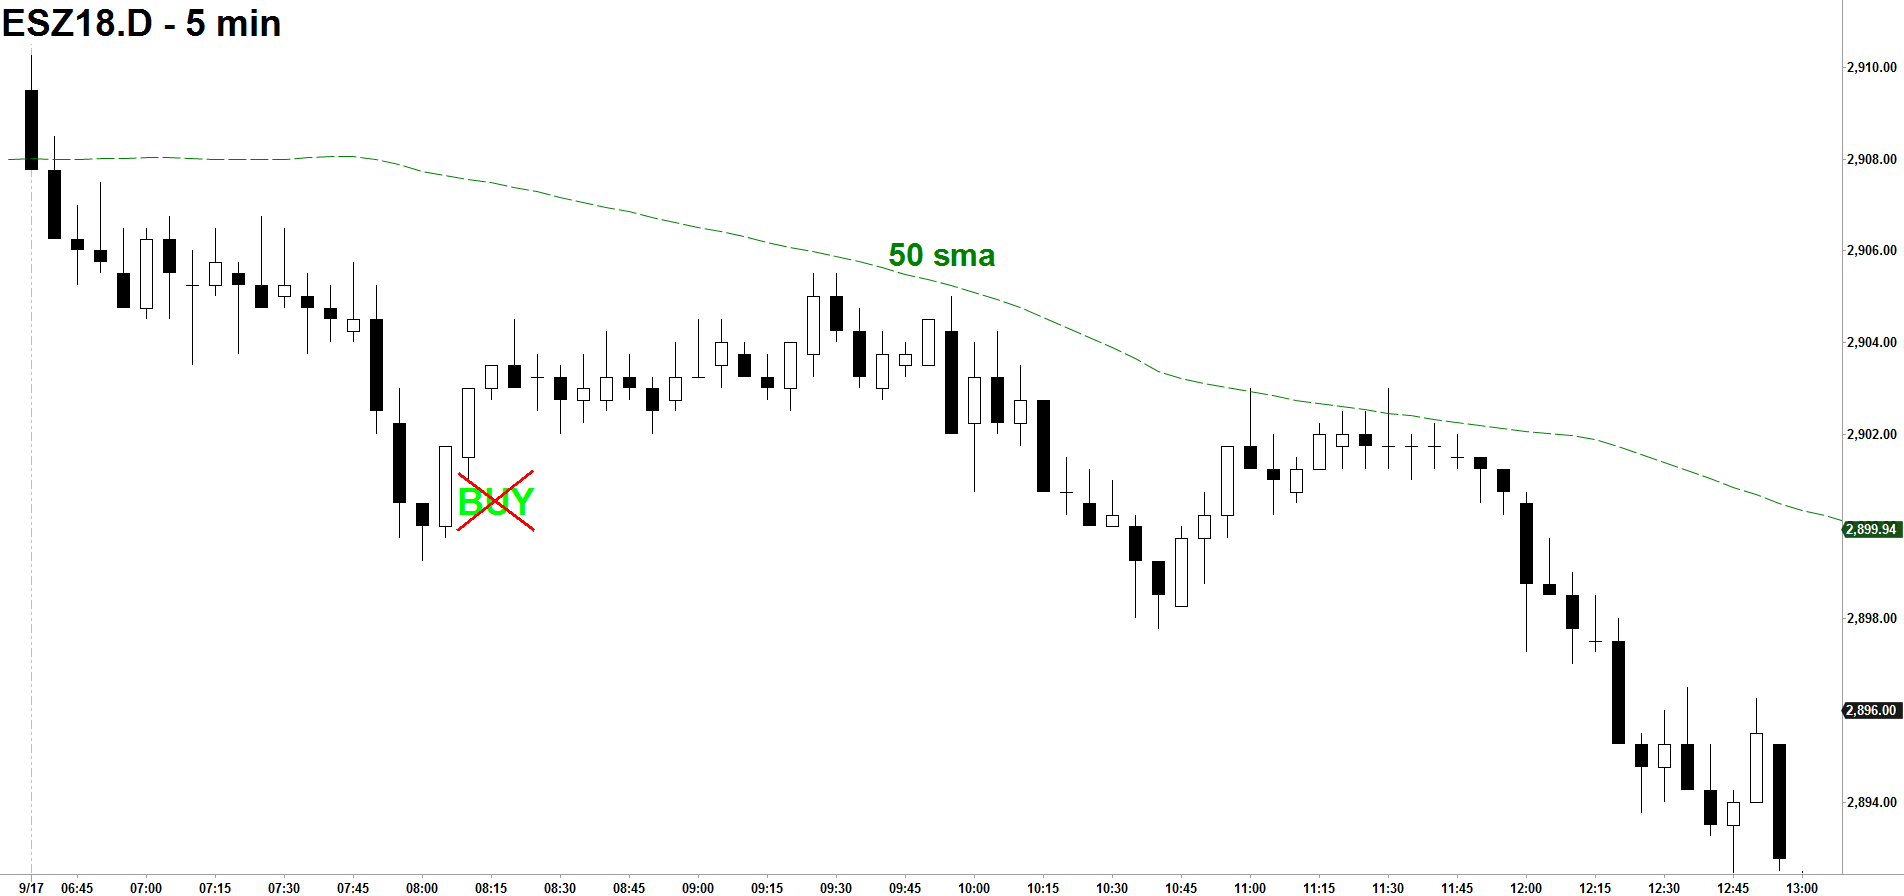
So how could this technique have helped us in the previous scenario? Let’s take a look at the same chart but this time with the Buy/Sell Line added (Fig. 3) Now we ask ourselves “Where is price in relation to the Buy/Sell Line?” and we notice that price has always been below the 50-period sma. Therefore we had no business in the world originally considering going long the Emini. Had we simply followed the rule from the start and looked for shorting instead of buying opportunities, we could have easily locked in some nice gains to the downside by mid morning.
Figure 3

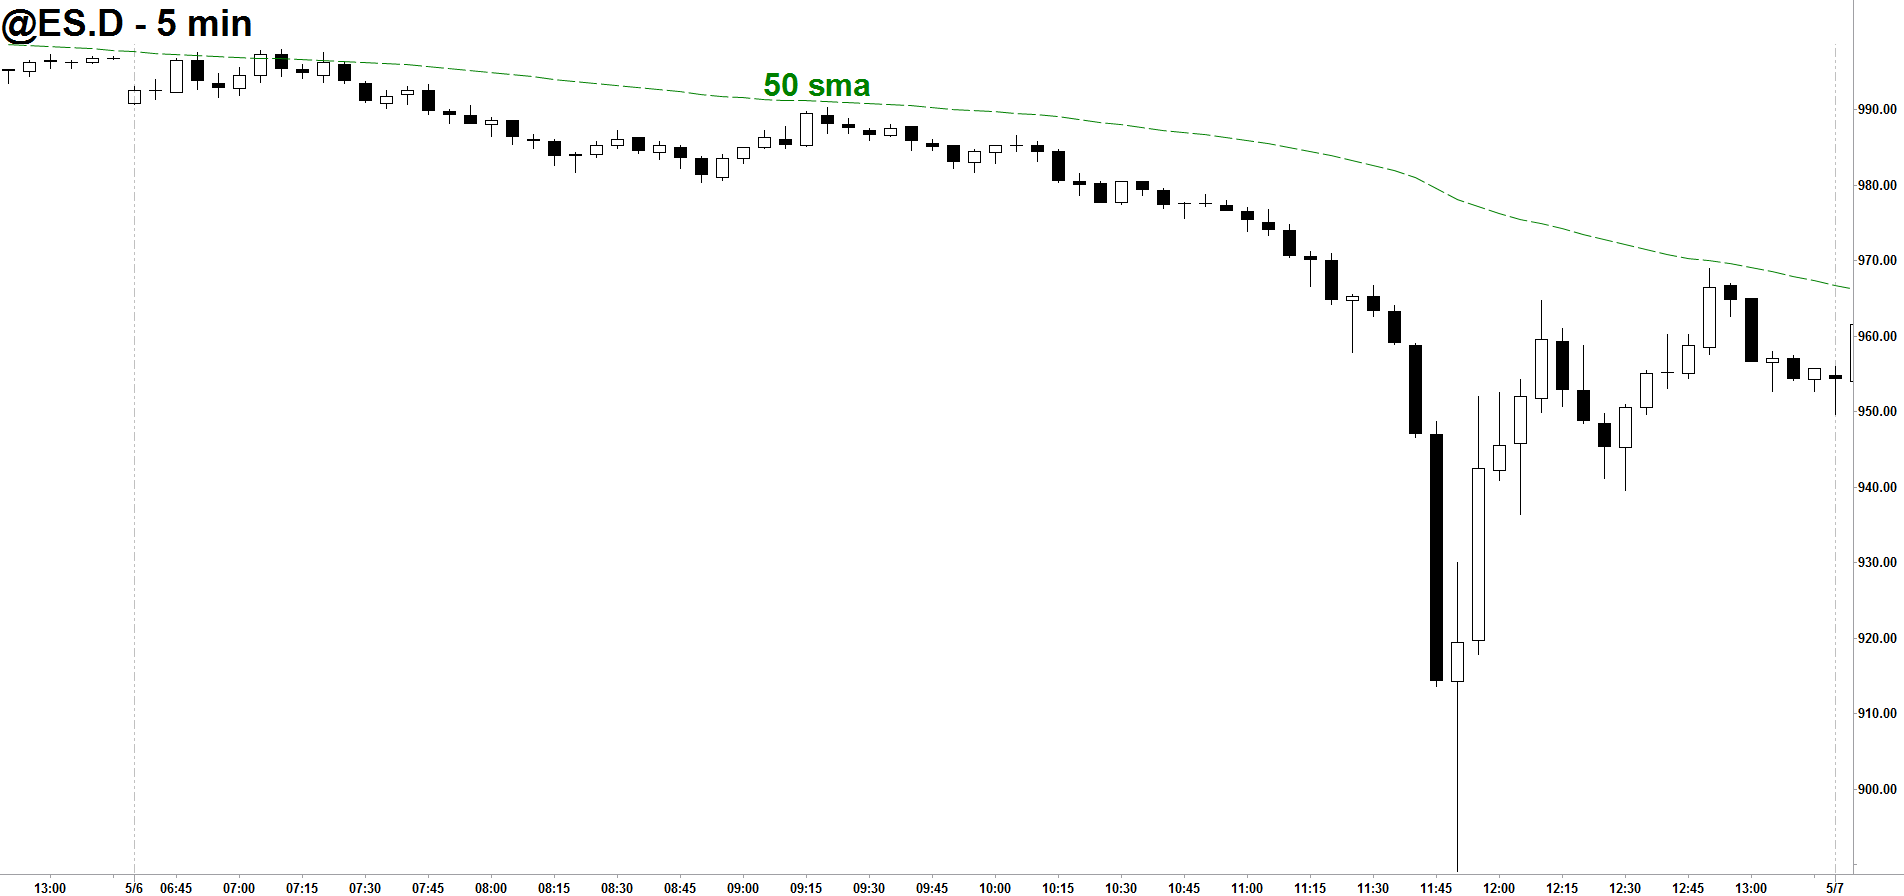
To see how well this tool transfers onto different time frames and in different directions, I’ve included snapshots of a 60-minute chart (Fig. 4), a daily chart (Fig. 5), and a 5-minute chart of the infamous “Flash Crash” of May 2010 (Fig.6). To summarize, in order to use the Buy/Sell Line properly always ask yourself this question before you pull the trigger “Where is price in relation to the Buy/Sell Line?” If price is above the Buy/Sell Line you’ll only be looking to go long, and if price is below the Buy/Sell Line you’ll only be looking to go short. I’m confident that once you begin to employ the Buy/Sell Line properly, you will take your Emini trading to the next level.
Figure 4

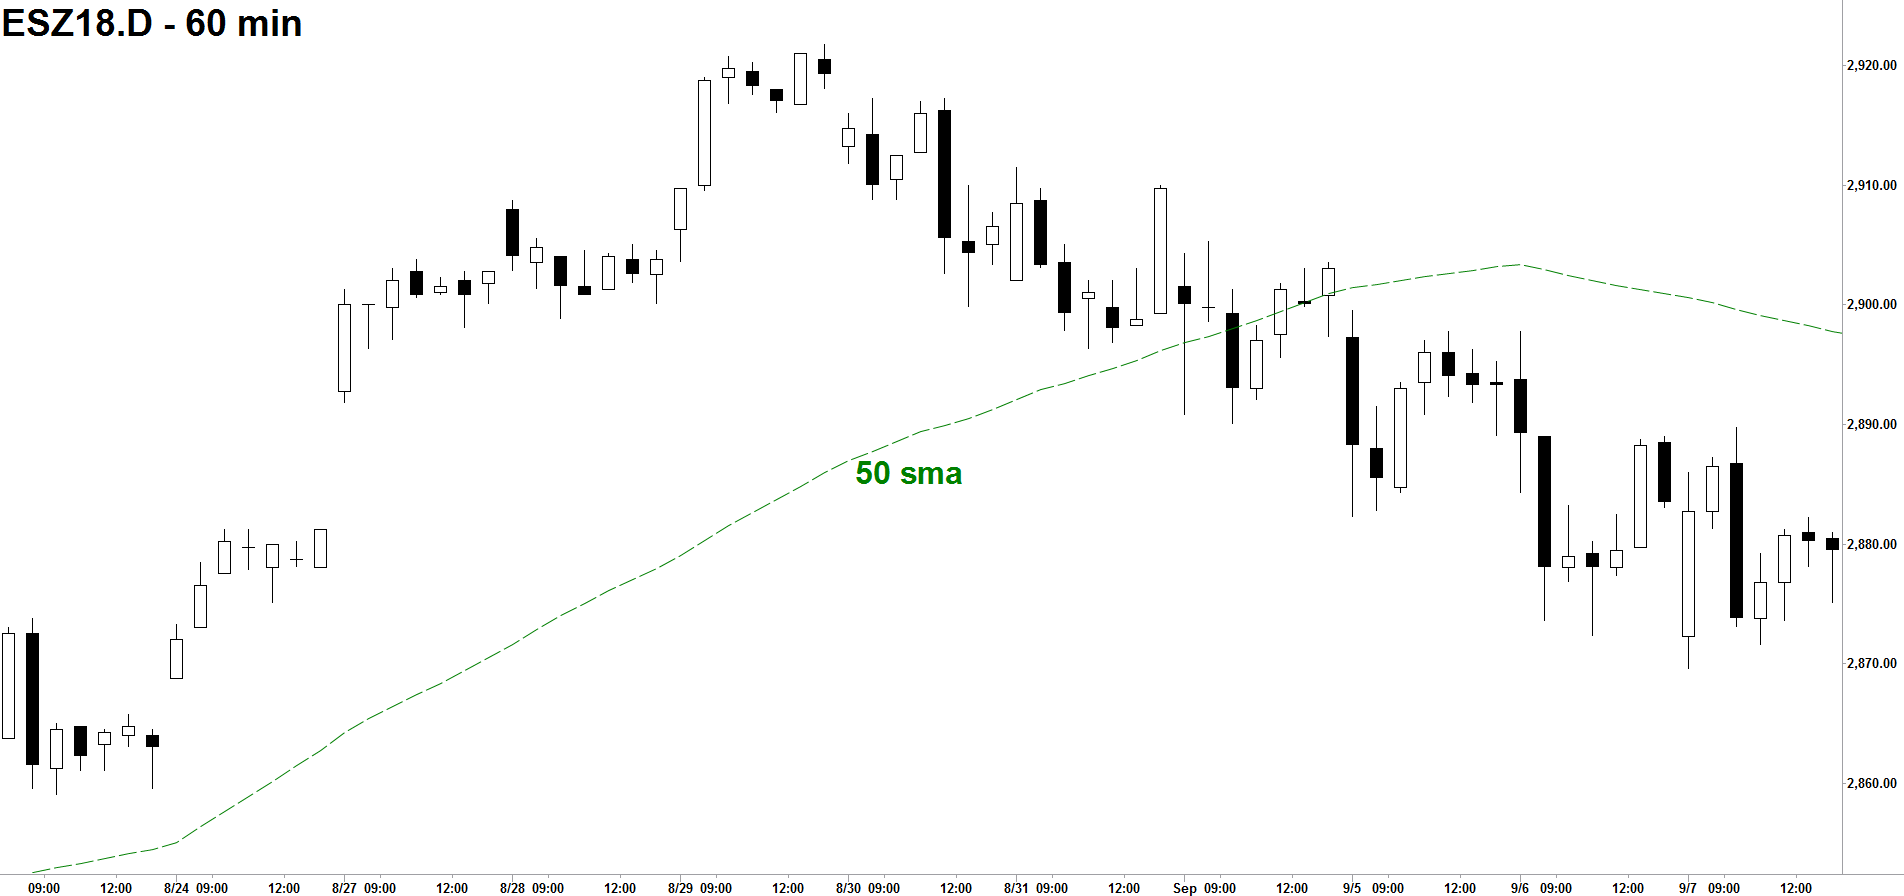
Figure 5

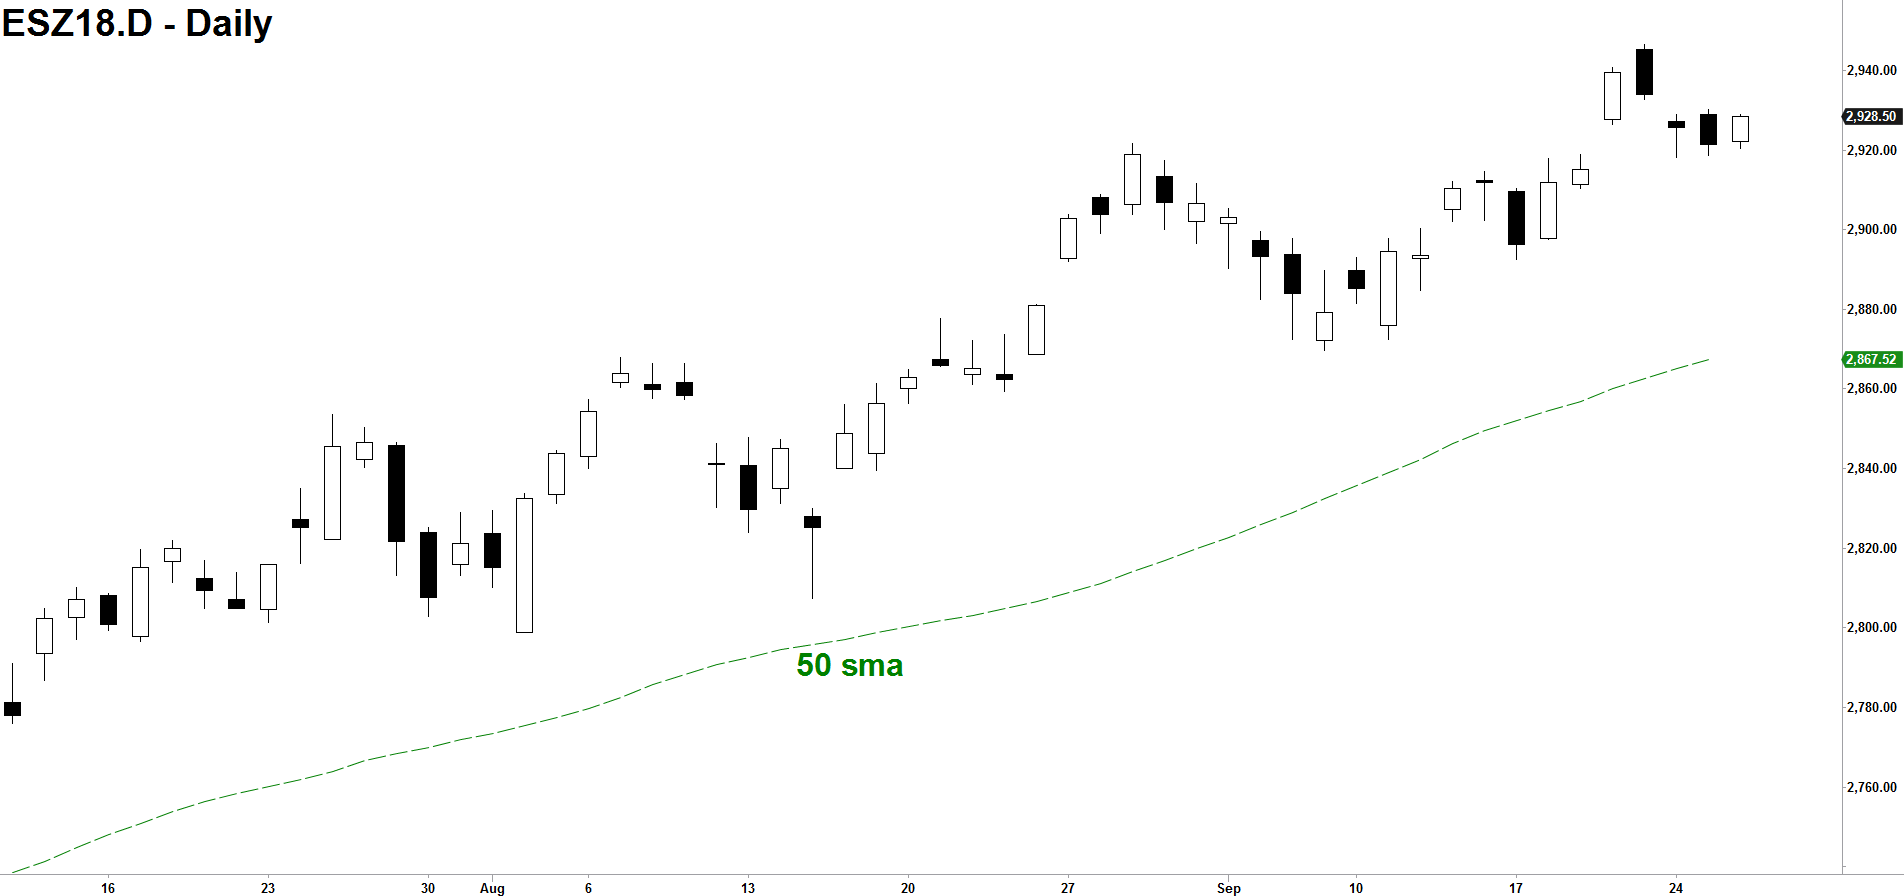
Figure 6

Edge #2
As I mentioned earlier, most traders attempt to buy at the exact bottom and sell at the exact top, regardless of market, time frame, or choice of trading strategy. But just where is the bottom and just where is the top? As we’ve all seen in the current market environment, the Eminis can go as high or low as they want, and much more than anyone could have ever expected. Rather than try to pick a top or bottom, which is often a recipe for disaster, the only thing needed is for a trader to wait for confirmation. This is the assurance that the Emini has concluded it’s downward course and is now once again headed in an upward direction. Much like a train leaving the station for it’s desired destination.
So what exactly is confirmation, and how do we use it? A buy confirmation consists of when the Emini, in an uptrend, has sold off to a satisfactory buy level and then reverses and trades higher than the previous bar’s high. Conversely, a sell confirmationconsists of when the Emini, in a downtrend, has risen to a satisfactory sell level and then reverses and trades lower than the previous bar’s low. We buy and sell only on confirmation, regardless of the strategy used.
The chart below (Fig. 7) shows a common trading technique used by many traders – going long the Emini once the stochastic oscillator has gone into “oversold” territory (“overbought” for sells). Had we purchased the Emini at point (A), when the indicator first went below the 20 threshold and into supposed oversold territory, we would have most likely held on to a losing trade for an extended period of time.
But had we simply waited for confirmation at point (B), which tells us to enter into a trade only after the future had traded one tick above the previous bar’s high, a buy in the Emini would have never been entered since price eventually went below the Buy/Sell Line (50 sma). Ironically, this is where most traders would have “thrown in the towel” and exited their original losing position! Using this method would have saved you a lot of money, grief, and heartache. The purpose of waiting for confirmation is not only to get us IN at the beginning of a trend, but to keep us OUT of bad trades as well.
Figure 7

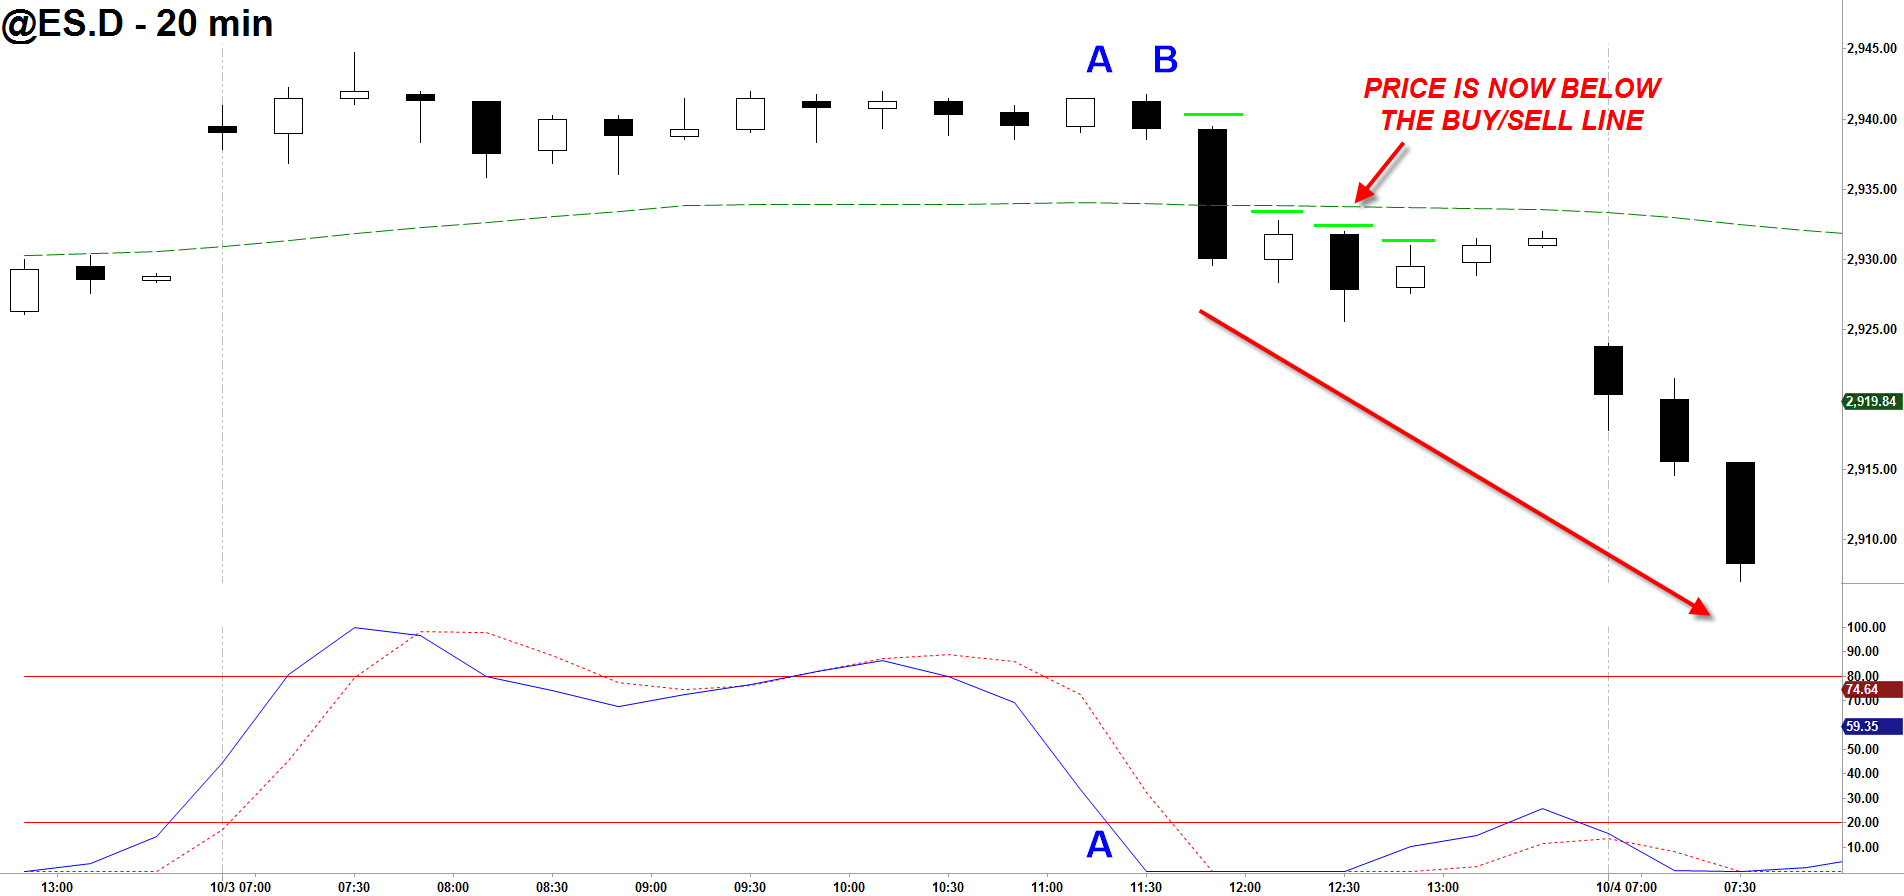
Figure 8

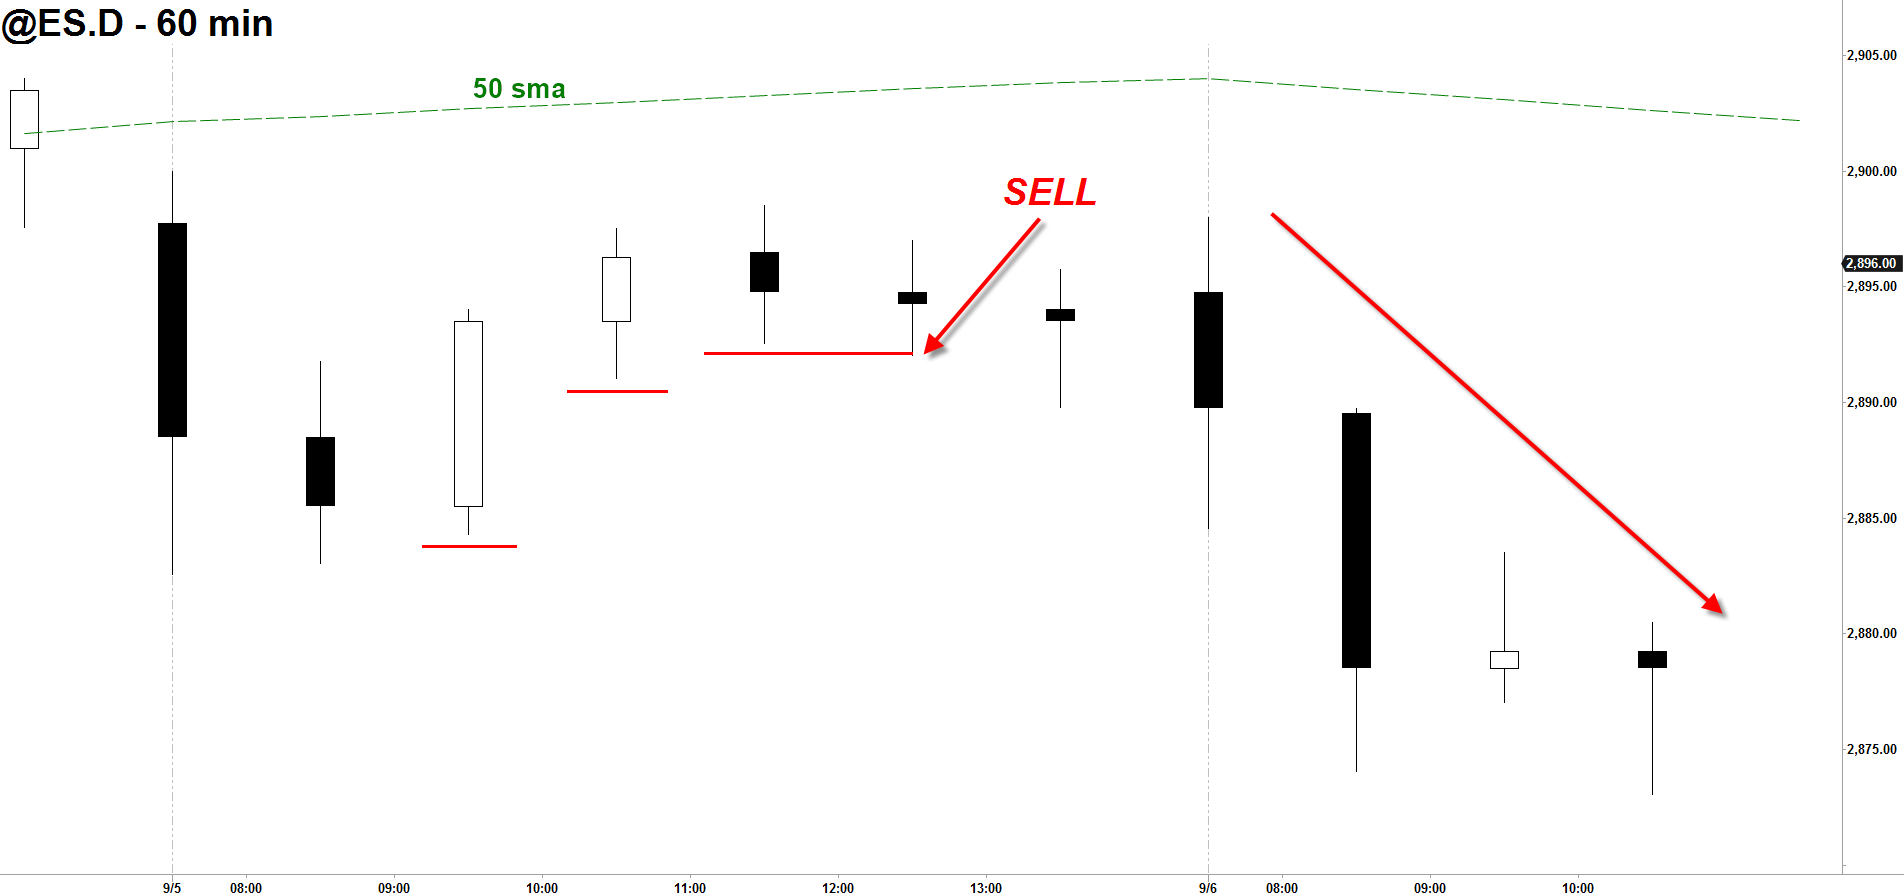
And in any time frame.
Figure 9

As you can see, if one trades without using confirmation they are simply guessing as to where to place their buy or sell orders. This guesswork is relative to top picking and bottom fishing; styles of trading that will eventually yield negative results.
But please be advised, just because a trade has been confirmed does not guarantee that it will become profitable. But by waiting for confirmation, one can substantially increase the odds for a successful trade in their favor. Confirmation is the verification that a directional move has concluded and that the trend has once again resumed. A Specialist always waits for his trade to be confirmed before entry.
Summary
Ultimately, these edges will not guarantee that all your Emini trades will become profitable, but if you do decide to employ these tools I feel you will substantially increase your odds for success. Why? Because The Buy/Sell Line is designed to put you on the right side of the market whereas Confirmation is the verification that a directional move has concluded and that the trend has resumed. Once you learn how to fully employ both these techniques you will be trading with the Specialist’s Edge.
THE SPECIAL OFFER
Get a 30-Day Trial of My PTS Primo Charts Program for just $7!
What you will get:
– A full, 30-day trial of my program for just $7
– You will get the trading strategy discussed in this video (Trading Strategy 3a)
– “STEPS” 1 & 2 Entry Techniques for fine-tuning your entries into trades
– Strategy Signal Scanner – Know which markets are triggered, according to the strategy
– Enhanced “BUY/SELL” line, which signals when markets are trending up or down
– Over 90 Technical Indicators
– Free Bloomberg TV for fundamental analysis
– Personalized Tech support for your individual needs
Get My PTS Primo Charts 30-Day Trial Here!
ABOUT THE AUTHOR

Author: Steven Primo, Founder
Company: Pro Trader Strategies, Specialist Trading
Websites: ProTraderStrategies.com, SpecialistTrading.com
Services Offered: Trading Courses, Trade Signals, Member’s Section, Videos
Markets Covered: Stocks, Emini Trading, Forex, Day Trading, Swing TradingScores of students, from beginner to advanced levels, have gone on to become successful traders after being introduced to Steven’s proprietary methods of trading.