
Combine these 3 strategies to help insure your sold strike never sees the light of day.
First Master the Chart for the Stock or Index You are Trading.
There is something valuable in watching a chart develop over time.
It’s interesting to note how much value early stock traders reported receiving from manually plotting a chart with pencil and paper back before computers became commonplace.
These traders swore that because of the painstaking method of tracking a stock by hand they got to know its movement intimately. It’s like getting to know the personality of the stock—the moods and patterns of what the stock is doing—-and likely to do next.
Even though we now have very sophisticated charting programs that instantaneously show every statistical detail of a stock’s movement at the click of a mouse, there is still value in watching a particular chart every day. Over time you get a feel for how the chart is likely to be drawn going forward, and you begin to anticipate those movements. For that reason it’s not a bad idea to narrow down the stocks or indices you trade to just a handful of very liquid issues.
Liquidity means there is a big market for the asset and many trades are being made every day. It also means the bid/ask spreads on the options will likely be more narrow, costing you less slippage—or built in costs of the trade.
Believe it or not there are traders who make a living trading just one primary index—it could the Nasdaq 100 ETF (QQQ) or the SP-500 (SPX) or (SPY) or the Dow 30 Industrials (DIA) or (DJX). The point is you can get to know your particular index really well and after a period of time become increasingly comfortable with it.
That isn’t to say these indices don’t produce surprises—they do—but you can learn to handle them with the right hedges, stop losses, buy-backs and other strategies to manage whatever the index dishes out.
So your first line of defense to get a feel for what you are trading, and you can do that by trading just a few charts and getting to know them really well. Fortunately for us, in addition to getting to know a chart, there are other tools we can use that are more defined, giving you harder statistical parameters to follow. This type of information is particularly useful in times of volatility.
Knowing how to place a trade during extreme movement is important because it is exactly at these times it is the most advantageous to place your trades.
How to use the MACD indicator
New PDF training guide explains the pillars of successful technical trading. Like how to understand common chart patterns, candlestick signals, stochastics and more.
Download it Now
Strategy Number One: Sell Outside the Extremes Using Bollinger Bands.
Bollinger Bands are a technical trading tool created by John Bollinger in the early 1980s. They arose from the need for adaptive trading bands and the observation that volatility is dynamic, and not static. Bollinger Bands can be laid over a chart using virtually any charting program—even some free programs on the Internet like the one at www.stockcharts.com.
The purpose of Bollinger Bands is to provide a relative definition of high and low—a good idea because we want to sell outside the extreme highs on the upside, and below the extreme lows on the downside.
But what is high or low? By definition, prices are high at the upper band and low at the lower band. This is critical information for figuring out when to place a trade that involves selling a strike price you don’t ever want to see hit during the period of the trade—for that reason Bollinger Bands are an important component in determining extremes.
Bollinger Bands consist of a set of three curves drawn in relation to a securities price. The middle band is a measure of the intermediate-term trend, usually a simple moving average that serves as the base for the upper and lower bands. The interval between the upper and lower bands and the middle band is determined by volatility, typically the standard deviation of the same data that was used for the average.
The default parameters are 20 periods and two standard deviations:
Middle Bollinger Band = 20-period simple moving average
Upper Bollinger Band = Middle Bollinger Band + 2 * 20- period standard deviation
Lower Bollinger Band = Middle Bollinger Band – 2 * 20- period standard deviation
Two important tools are derived from the Bollinger Bands: BandWidth, a relative measure of the width of the bands, and %b, a measure of where the last price is in relation to the bands.
BandWidth = (Upper Bollinger Band – Lower Bollinger Band) / Middle Bollinger Band %b = (Last – Lower Bollinger Band) / (Upper Bollinger Band – Lower Bollinger Band) BandWidth is most often used to quantify a volatility-based trading opportunity. %b is used to clarify trading patterns and as an input for trading systems.
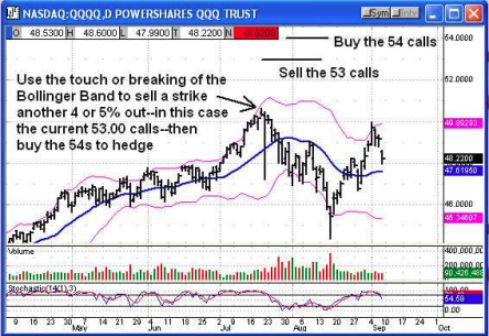
So one of the ways to create a credit spread with the highest likelihood of expiring worthless is to only trade when the stock or index you are following hits or exceeds the outer reaches of either the upper or lower Bollinger Band—and then sell a strike price at least five to six percent further out-of-the money from the band assuming you are selling less than 3 weeks of time.
An example would be an index that has traded over the past six months in a range between 44 at the low end and 51 at the high end and you notice that the index is trading at the upper Bollinger Band—very close to 51.00. You would then sell a strike price approximately five percent higher than that—in this case anything more than 2.55 (5%)—say 2 strikes—the 53.00 strike price or above.
The basis for this strategy is this: if we initiate our trade at the outer Bollinger Band AND the stock is toward the extreme end of its recent range then we are assuming that by definition the price is extreme.
The index has already moved quite a bit to get there and is therefore over-extended. Over-extended stocks tend to snap-back toward the middle trend.
We know based on the mathematical theory of ‘reversion to the mean’ that the further price travels away from the mean (the middle line of the Bollinger Bands) the more over-extended and the greater the likelihood of a reversal back toward the average. Think of price having a rubber band attached to it and the other end of the rubber band is attached to the mean or average price. The further price travels away from the mean, the tighter this rubber band gets stretched and the greater the probability of a movement back inside the channel toward the average price.
So if price is already extended at the outer Bollinger Band and the stock is toward the extreme end of its range we’ll sell four to six percent beyond the current price. That way the price would have to become super overextended to touch our sold strike. Super over-extended happens occasionally, but not often—and the likelihood is that it will correct itself by reverting back toward the average price before your strike is touched—and this is key.
You always want to stack the averages in your favor and selling option strike prices well outside the outer Bollinger Band is a great way to do it, assuming the outer band is two standard deviations away from the mean.
Another way to use Bollinger Bands is to place bands at two standard deviations for the trade trigger, and three standard deviations for the sold strike selection. This effectively creates an over-sold or over-bought band as a trade alert indicator, and a ‘super-extreme’ band even further out as a strike point to sell premium.
The beauty of this strategy is if you overlay a chart with a three standard deviation Bollinger Band channel you’ll find that the stock price almost never reaches this three deviation line—it simply requires too much of an over-extension of price to occur.
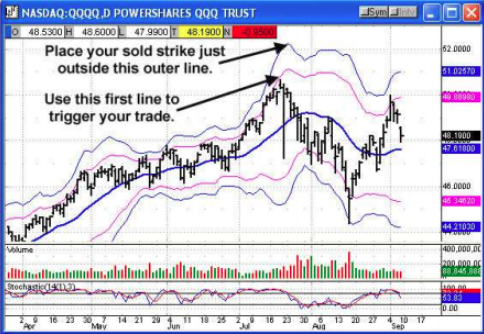
You can easily back-test this three standard deviation model by applying the bands and then looking back over the chart you are trading to determine when—if ever—this third deviation line is penetrated. You’ll likely find it reassuring to see that this is a very rare occurrence making selling a strike at this 3 standard deviation line a high profit, low risk proposition—exactly the kind of trade we’re looking for.
Strategy Number Two: Trade at Implied Volatility Extremes
We’ve just seen how using Bollinger Bands to determine extremes can be an effective way to make sure your sold strike is never hit, but we can go even further.
It’s always a good idea to confirm any indicator with other indicators to give yourself even better odds of winning. So Bollinger Bands give you an indication of whether or not price is at an extreme, but there is another indicator we can use to tell us whether or not the extreme is likely to be reversed in the immediate future.
This indicator is called implied volatility and it can most easily be seen in various volatility indices. There are currently many volatility measures in the markets, but the most popular is the volatility index for the SP-500 (VIX), the volatility index for the SP-100 (VXO) and the volatility index for the Nasdaq 100 (VXN).
These volatility indices are calculated by measuring the implied volatility of several different strike prices around the main asset to determine the level of implied volatility priced into that asset at any given moment.
Here is how the volatility is computed on the SP-500 (VIX): The Volatility Index for the SP-500 (VIX) is a weighted measure of the implied volatility for 8 SPX put and call options. The 8 puts and calls are weighted according to the time remaining and the degree to which they are in or out of the money. The result forms a composite hypothetical option that is at-the-money and has 30 days to expiration.
An at the-money option means that the strike price and the security price are the same. The VIX represents the implied volatility for this hypothetical at-the-money SPX option. Once volatility is determined it can be graphed just like a stock chart and the rules of technical analysis can be applied just as if you were analyzing a stock. In fact there is a striking correlation between the volatility graph for a certain asset and the asset itself—they are almost exactly the opposite of each other.
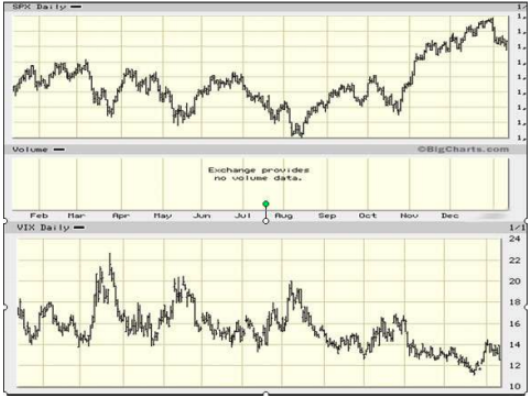
The reason for this very close correlation is because as an asset falls in price traders become more fearful and factor more value into the time portion of an option’s price, increasing its implied volatility.
On the opposite side, if the asset rises in price, traders become more complacent and the implied volatility falls. This is why a volatility index is often called the ‘fear index’, because it measures the amount of fear or uncertainty around that asset at any given moment.
What we’ll use the volatility indices for is to determine extremes of market sentiment—and when those extremes are likely to reverse and change direction. This is a useful tool in determining when to sell an option for a relatively large premium, and then buying it back later when volatility has collapsed, or simply letting it expire worthless.
One of the things I want you to notice about the SPX/VIX chart just shown is that volatility can stay low for long periods of time while an index just keeps climbing higher. It seems traders (just like us regular people) have a much higher tolerance for complacency than they do fear. The point is that even if a volatility index drops to super low levels it doesn’t necessarily mean that there is a major change in direction coming soon.
On the flipside, however, you’ll notice from the volatility chart above that extremely high volatility—usually associated with a plunging market—does not seem to be sustainable for long. In other words extremely high levels of fear usually peak for a few days and then rapidly turnaround as some piece of news comes out to calm investors.
What that means is that extremely high levels of volatility can be used to mark an impending change in direction—a dramatic spike higher in volatility corresponds to a dramatic plunge in value in the underlying asset AND a bounce higher in the asset usually occurs within a very short time.
As an options seller you get a double bonus from this huge spike in volatility. The first bonus is that you can use it with your Bollinger Bands to confirm an extreme down move is about to end, triggering the initiation of a new trade, which for us in this circumstance would be a bull put spread.
If volatility is high then it likely means the price of the underlying will be spiking higher from some kind of a ‘V’ bottom so you would sell puts out-of-the-money with a high probability of a rise in the stock, allowing a much cheaper buy-back of the options you sold or a worthless expiration.
The second bonus is that when volatility is extremely high so are option prices—which means you’ll not only know when to sell (on the downside) but you’ll also get a lot more premium when you do.
This is critical because during times of spiking volatility you’ll sell your options for a lot more money than what you could normally get, and the value of those options will collapse much faster as volatility drops back to normal.
Time decay and the stock moving away from your sold strike are your first two money makers. When you sell an option to create a credit spread, you want the value of your sold options to evaporate as fast as possible—-we usually accomplish that through time decay and a bet that the underlying will move away from our sold strike. But you have a third value enhancer going for you when you sell high volatility—a phenomenon referred to as ‘volatility collapse’.
Strategy Number Three: Sell Inflated Volatility Making ‘Volatility Collapse’ Your Third Money Maker.
When you look at a volatility graph you’ll see where extreme highs don’t last—and when volatility plummets it collapses the time value of an option with it–giving you a chance to close the trade early for little cost, or hang on for a worthless expiration.
The best approach to knowing when to initiate your credit spread is to sell out-of-the-money strikes at price extremes and you can use the three methods above to do it. You’ll notice all three are technical indicators—in other words they are all based on either price or volume—the two key ingredients from which all technical indicators are derived.
However it’s important to give a quick nod to the fundamentals, because it’s important to stack the deck in your favor as much as we possibly can. The chart is great, but in addition look ahead on the calendar to see what is coming.
When you create a credit spread you want to look forward to the expiration date and ask yourself if there is anything during the period of time you’ll have this position open that might cause the stock to move dramatically enough to endanger your position. Essentially when you create a credit spread you either want the stock price to do nothing or move away from your spread strikes.
So if you sell say two weeks of time, look ahead and gauge what news might come out during that time period that might seriously impact the price of the stock you are selling against. One big event that comes to mind and happens like clockwork four times per year is a company’s earnings release.
Placing a credit spread before an earnings release is really taking on a lot of risk because you never know which way a stock is likely to jump after its quarterly numbers are announced.
Sometimes bad news is perceived as good news and a stock jumps on negative earnings—and sometimes a stock can have an excellent quarter and the stock drops— there is just no way to be sure. For that reason it’s best to create credit spreads during a time when volatility is high but very likely to decrease in the weeks ahead—and that usually means during a period of little significant news.
.png)
In fact a surprisingly good time to create a credit spread is often right after an earnings release.
For one thing you’ll have a good idea of what direction the stock will be heading as you see the market’s reaction to earnings. Plus volatility usually pops right as the news is released giving you a chance to collect more premium—and then decreases dramatically after the news is digested giving you an easy coast into expiration.
But you don’t have to wait for an earnings release—any gap either higher or lower is a good time to sell—just make sure you are selling your spread the opposite direction that the stock is heading. In other words if the stock is heading higher sell a put spread–if the stock is heading lower sell a call spread.
Congratulations—You Have Just Stacked the Deck Massively in Your Favor.
So now you’ve got three effective technical approaches and one effective fundamental approach toward making sure the stock price never gets past your sold strike. If you use these tools you’ll find that the vast majority of your short term out-of-the-money credit spreads go exactly the way you hope they will—terminating in a worthless expiration or a tiny buy-back with you keeping all or most of the credit.
After a few months of trading this way you might be surprised how much money accumulates in your account— especially if you learn to manage the occasional surprise. The reason managing surprises is so important is because even though we’ve arranged to have a super low possibility of something unexpected happening, the real world has an irritating habit of springing surprises more regularly than you would hope.
So what happens when you’ve done everything right and your spread is still being threatened? That’s what you’ll find out inside The Winning Secret. To find out more and to take advantage of a special combination offer associated with this report go to this page now.
See How To Maximize Your Profits By Clicking Here!
ABOUT THE AUTHOR